
Page 18 - Data Visualization aligned
P. 18
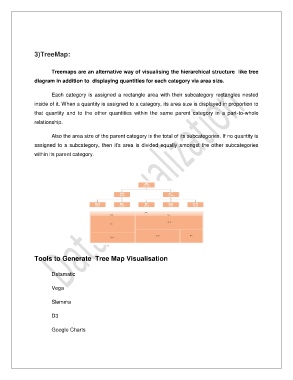
3)TreeMap:


                       Treemaps are an alternative way of visualising the hierarchical structure  like tree
               diagram in addition to  displaying quantities for each category via area size.


                       Each  category  is  assigned  a  rectangle  area  with  their  subcategory  rectangles  nested
               inside of it. When a quantity is assigned to a category, its area size is displayed in proportion to

               that  quantity  and  to  the  other  quantities  within  the  same  parent  category  in  a  part-to-whole
               relationship.


                       Also the area size of the parent category is the total of its subcategories. If no quantity is
               assigned to a subcategory, then it's area is divided equally amongst the other subcategories
               within its parent category.


               Tools to Generate  Tree Map Visualisation


                       Datamatic

                       Vega


                       Slemma


                       D3

                       Google Charts