
Page 24 - Data Visualization aligned
P. 24
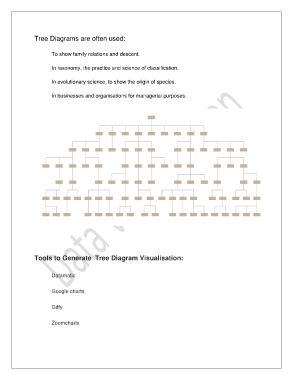
Tree Diagrams are often used:


                       To show family relations and descent.


                       In taxonomy, the practice and science of classification.

                       In evolutionary science, to show the origin of species.


                       In businesses and organisations for managerial purposes.


               Tools to Generate  Tree Diagram Visualisation:


                       Datamatic


                       Google charts


                       Giffy


                       Zoomcharts