Page 328 - Maxwell House
P. 328
308                                                                Chapter 6


        of (6.29) and (6.30) postponing the numerical one until the next section. Note only again that
        analytical solution could be actually found for quite restricted number of line geometries. For
        example, this group includes a coaxial cable, rectangular, circular of elliptical waveguides and
        some others where the boundaries coincide with orthogonal coordinate lines.


        6.6  MORE INFORMATION ABOUT FEED LINES

        6.6.1   Introduction
        The most data in this section are the results of numerical simulations based on MATLAB code
                              ®
        and CST STUDIO SUITE  software. We hope that this set of field patterns and plots of feed
        characteristics can help our reader better navigate the numerical simulation process and would
        serve as the first of the design steps in some applications.
        6.6.2   Two-Wire Line

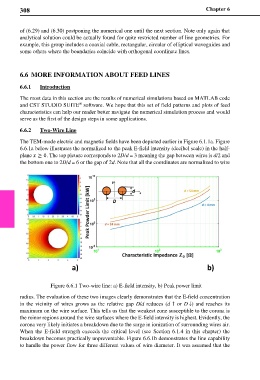
        The TEM-mode electric and magnetic fields have been depicted earlier in Figure 6.1.1a. Figure
        6.6.1a below illustrates the normalized to the peak E-field intensity (decibel scale) in the half-
        plane  ≥ 0. The top picture corresponds to 2D/d = 3 meaning the gap between wires is d/2 and
        the bottom one to 2D/d = 6 or the gap of 2d. Note that all the coordinates are normalized to wire


                           a)                                               b)

                            Figure 6.6.1 Two-wire line: a) E-field intensity, b) Peak power limit

        radius. The evaluation of these two images clearly demonstrates that the E-field concentration

        in the vicinity of  wires grows as the relative gap D/d reduces (d ↑ or D ↓) and reaches its
        maximum on the wire surface. This tells us that the weakest zone susceptible to the corona is
        the minor regions around the wire surfaces where the E-field intensity is highest. Evidently, the
        corona very likely initiates a breakdown due to the surge in ionization of surrounding wires air.
        When the  E-field  strength exceeds the critical level (see  Section  6.1.4  in this chapter) the
        breakdown becomes practically unpreventable. Figure 6.6.1b demonstrates the line capability
        to handle the power flow for three different values of wire diameter. It was assumed that the

