Page 329 - Maxwell House
P. 329
FEED LINE BASICS                                                        309


            line is surrounded by dry air on the sea level at 20℃ while the electrical breakdown field
            strength is 3 MV/m. It is advisable to use in practice the values approximately tenfold below
            taking into consideration the harsh environment of open space. According to graphs in Figure
            6.6.1b, the ability of the two-wire line to carry high electric power is in the range of hundreds
            of MW. That is why different modifications of such line like shown in Figure 6.2.1 are widely
            used  as overhead  power lines to deliver and distribute  AC electrical energy along  long
            distances. Since the operating voltage in such lines reaches 1 MV, the line wires should be
            separated quite extensively creating thereby the large field radius as Figure 6.1.1b illustrates.

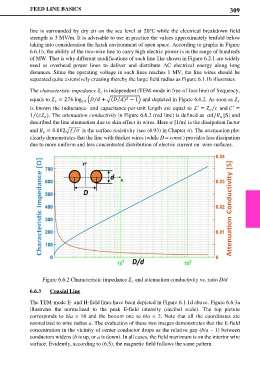
            The characteristic impedance   is independent (TEM-mode in free-of-loss line) of frequency,

                                              2
            equals to  = 276 log 10 �/ + �( ) − 1� and depicted in Figure 6.6.2. As soon as
                                           ⁄


                                                                                     ′
                                                                        ′
                                                                             ⁄
            is known  the inductance- and capacitance-per-unit length are equal to ℒ =   and  =

            1 ( ). The attenuation conductivity in Figure 6.6.2 (red line) is defined as  /  [S] and
             ⁄

            described the line attenuation due to skin effect in wires. Here  [1/m] is the dissipation factor
            and  = 0.002�   is the surface resistivity (see (4.93) in Chapter 4). The attenuation plot
                           ⁄

            clearly demonstrates that the line with thicker wires (while D = const.) provides less dissipation
            due to more uniform and less concentrated distribution of electric current on  wire surfaces.


                Figure 6.6.2 Characteristic impedance   and attenuation conductivity vs. ratio D/d

            6.6.3   Coaxial Line
            The TEM-mode E- and H-field lines have been depicted in Figure 6.1.1d above. Figure 6.6.3a
            illustrates the normalized to the peak E-field intensity  (decibel scale).  The top picture
            corresponds to  b/a  =  16 and the bottom one to  b/a  = 2.  Note that all the coordinates are
            normalized to wire radius a. The evaluation of these two images demonstrates that the E-field
            concentration in the vicinity of center conductor drops as the relative gap (b/a – 1) between
            conductors widens (b is up, or a is down). In all cases, the field maximum is on the interior wire
            surface. Evidently, according to (6.5), the magnetic field follows the same pattern.

