
Page 396 - Maxwell House
P. 396
376 Chapter 7
The first two expressions are the simple balance of active power taking place in the lossless
circuit where 1 is the normalized input active power. From them we get | |= | |
22
11
and | | = �1 − | | . The last equity in (7.13) is the consequence of the reactive power
2
21
11
balance where 0 means the absence of the input and output reactive power. It reveals that the
phase of transmission coefficient 21 = | | 21 and reflection coefficient 11 =
21
| | 11 must be mutually dependent parameters
11
2 21 = 11 + 22 + (7.14)
Therefore, the reciprocal and lossless 2-port network could be described by the single complex
parameter or two reals | | and as soon as it is
11
11
11
2 11
11 �1 − | |
11
Symmetrical, i.e. 22 = and = � �
11
�1 − | | 11
2 11
11
�1 − | |
2 11
Asymmetrical, i.e. 22 = − and = � 11 11 � (7.15)
11
2 11
�1 − | | − 11
11
Evidently, all discontinuities in Table 7.1 and 7.2 fall into one of these categories.
7.3.4 Scattering Transfer T-Matrix
The S-matrix introduced in the previous section is a very convenient way to describe an N-port
network linking the reflected wave on one port with incident waves in all others. Such
description is very well adapted to measurements and simulations but becomes slightly
problematic for the description of the multiple networks connected in a cascade like shown in
Figure 7.3.3a. The equivalent circuit of a transmission line demonstrated in Figure 6.1.2b is
exemplary. A common class of filters, phase shifters, matching devices, and a wide range of
RF components are realized by cascading simple resonance, switching elements, or other
discontinuities. To simplify the discussion, the following analysis is limited to the sequence of
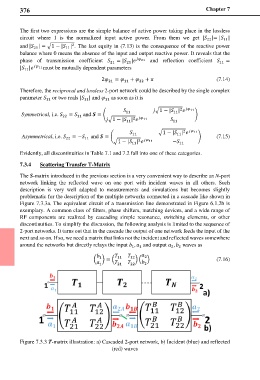
2-port networks. It turns out that in the cascade the output of one network feeds the input of the
next and so on. If so, we need a matrix that links not the incident and reflected waves somewhere
around the networks but directly relays the input , and output , waves as
2
1
2
1
11 12 2
1
� � = � � � � (7.16)
1 21 22 2
Figure 7.3.3 T-matrix illustration: a) Cascaded 2-port network, b) Incident (blue) and reflected
(red) waves