
Page 46 - CAREPOINT GLOBAL BUSINESS PLAN
P. 46
CarePoint Global Business Plan
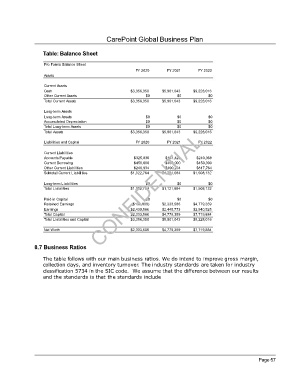
Table: Balance Sheet
Pro Forma Balance Sheet
FY 2020 FY 2021 FY 2022
Assets
Current Assets
Cash $3,356,350 $5,901,043 $9,228,016
Other Current Assets $0 $0 $0
Total Current Assets $3,356,350 $5,901,043 $9,228,016
Long-term Assets
Long-term Assets $0 $0 $0
Accumulated Depreciation $0 $0 $0
Total Long-term Assets $0 $0 $0
Total Assets $3,356,350 $5,901,043 $9,228,016
Liabilities and Capital FY 2020 FY 2021 FY 2022
Current Liabilities
Accounts Payable $325,830 $181,420 $240,368
Current Borrowing $450,000 $450,000 $450,000
Other Current Liabilities $246,934 $490,264 $817,764
Subtotal Current Liabilities $1,022,764 $1,121,684 $1,508,132
Long-term Liabilities $0 $0 $0
$1,121,684
Total Liabilities CONFIDENTIAL $1,508,132
$1,022,764
Paid-in Capital $0 $0 $0
Retained Earnings ($106,000) $2,333,586 $4,779,359
Earnings $2,439,586 $2,445,773 $2,940,525
Total Capital $2,333,586 $4,779,359 $7,719,884
Total Liabilities and Capital $3,356,350 $5,901,043 $9,228,016
Net Worth $2,333,586 $4,779,359 $7,719,884
8.7 Business Ratios
The table follows with our main business ratios. We do intend to improve gross margin,
collection days, and inventory turnover. The industry standards are taken for industry
classification 5734 in the SIC code. We assume that the difference between our results
and the standards is that the standards include
Page 57
CarePoint Global Business Plan +966 55 119 6445