
Page 47 - CAREPOINT GLOBAL BUSINESS PLAN
P. 47
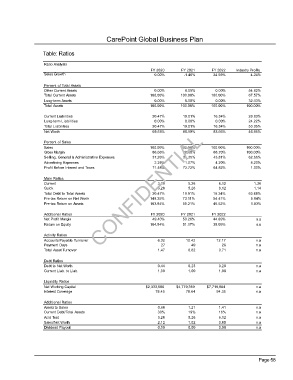
CarePoint Global Business Plan

                   Table: Ratios

                   Ratio Analysis

                                                                FY 2020      FY 2021      FY 2022   Industry Profile
                   Sales Growth                                   0.00%       -1.46%      34.59%          4.24%

                   Percent of Total Assets

                   Other Current Assets                           0.00%       0.00%        0.00%         54.82%
                   Total Current Assets                         100.00%      100.00%     100.00%         67.57%
                   Long-term Assets                               0.00%       0.00%        0.00%         32.43%
                   Total Assets                                 100.00%      100.00%     100.00%        100.00%

                   Current Liabilities                           30.47%      19.01%       16.34%         28.83%
                   Long-term Liabilities                          0.00%       0.00%        0.00%         24.22%
                   Total Liabilities                             30.47%      19.01%       16.34%         53.05%
                   Net Worth                                     69.53%      80.99%       83.66%         46.95%

                   Percent of Sales

                   Sales                                        100.00%      100.00%     100.00%        100.00%
                   Gross Margin                                  86.66%      88.60%       88.70%        100.00%
                   Selling, General & Administrative Expenses    37.26%      38.35%       43.81%         62.66%
                   Advertising Expenses                           2.25%       1.07%        4.20%          8.20%
                   Profit Before Interest and Taxes              71.48%      72.72%       64.82%          1.00%

                   Main Ratios

                   Current                                         3.28         5.26        6.12           1.36
                                                                   3.28
                   Quick                  CONFIDENTIAL                          5.26        6.12           1.14
                   Total Debt to Total Assets                    30.47%      19.01%       16.34%         63.68%
                   Pre-tax Return on Net Worth                  149.35%      73.11%       54.41%          5.04%
                   Pre-tax Return on Assets                     103.84%      59.21%       45.52%          1.83%

                   Additional Ratios                            FY 2020      FY 2021      FY 2022
                   Net Profit Margin                             49.40%      50.26%       44.89%            n.a
                   Return on Equity                             104.54%      51.17%       38.09%            n.a

                   Activity Ratios

                   Accounts Payable Turnover                       6.32        10.42       12.17            n.a
                   Payment Days                                     27           49           26            n.a
                   Total Asset Turnover                            1.47         0.82        0.71            n.a

                   Debt Ratios

                   Debt to Net Worth                               0.44         0.23        0.20            n.a
                   Current Liab. to Liab.                          1.00         1.00        1.00            n.a

                   Liquidity Ratios

                   Net Working Capital                        $2,333,586   $4,779,359   $7,719,884          n.a
                   Interest Coverage                              78.45        78.64       94.35            n.a

                   Additional Ratios

                   Assets to Sales                                 0.68         1.21        1.41            n.a
                   Current Debt/Total Assets                       30%          19%         16%             n.a
                   Acid Test                                       3.28         5.26        6.12            n.a
                   Sales/Net Worth                                 2.12         1.02        0.85            n.a
                   Dividend Payout                                 0.00         0.00        0.00            n.a


                                                                                                             Page 58


        CarePoint Global Business Plan                   +966 55 119 6445                                      [Type here]