
Page 10 - D&C Business Plan Summary
P. 10
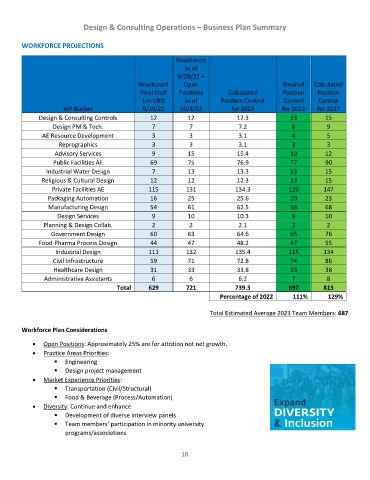
Design & Consulting Operations – Business Plan Summary

        WORKFORCE PROJECTIONS

                                                           Headcount
                                                              as of
                                                            9/29/22 +
                                               Headcount      Open                             Desired    Calculated
                                               Final Staff   Positions       Calculated        Position   Position
                                                List UKG      as of       Position Control     Control    Control
                      WF Bucket                 9/29/22      10/3/22          for 2023        for 2023    for 2027
              Design & Consulting Controls         12          12              12.3              13          15
                  Design PM & Tech.                7            7               7.2               8          9
               AE Resource Development             3            3               3.1               4          5
                    Reprographics                  3            3               3.1               3          3
                   Advisory Services               9           15              15.4              10          12
                   Public Facilities AE            69          75              76.9              77          90
                Industrial Water Design            7           13              13.3              13          15
               Religious & Cultural Design         12          12              12.3              13          15
                  Private Facilities AE           115          131             134.3             126        147
                 Packaging Automation              16          25              25.6              20          23
                 Manufacturing Design              54          61              62.5              58          68
                    Design Services                9           10              10.3               9          10
               Planning & Design Collab.           2            2               2.1               2          2
                  Government Design                60          63              64.6              65          76
              Food-Pharma Process Design           44          47              48.2              47          55
                   Industrial Design              111          132             135.4             115        134
                   Civil Infrastructure            59          71              72.8              74          86
                   Healthcare Design               31          33              33.8              33          38
                Administrative Assistants          6            6               6.2               7          8
                                        Total     629          721             739.3             697        813
                                                                          Percentage of 2022      111%        129%

                                                                      Total Estimated Average 2023 Team Members: 687

        Workforce Plan Considerations
            •  Open Positions: Approximately 25% are for attrition not net growth.
            •  Practice Areas Priorities:
                   ▪  Engineering
                   ▪  Design project management
            •  Market Experience Priorities:
                   ▪  Transportation (Civil/Structural)
                   ▪  Food & Beverage (Process/Automation)
            •  Diversity: Continue and enhance
                   ▪  Development of diverse interview panels
                   ▪  Team members’ participation in minority university
                       programs/associations


                                                             10