
Page 6 - D&C Business Plan Summary
P. 6
Design & Consulting Operations – Business Plan Summary
DESIGN SERVICES
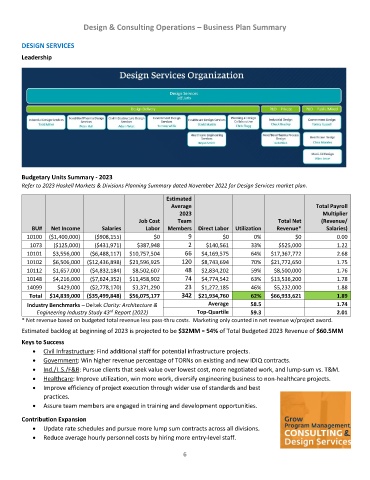
Leadership
Budgetary Units Summary - 2023
Refer to 2023 Haskell Markets & Divisions Planning Summary dated November 2022 for Design Services market plan.
Estimated
Average Total Payroll
2023 Multiplier
Job Cost Team Total Net (Revenue/
BU# Net Income Salaries Labor Members Direct Labor Utilization Revenue* Salaries)
10100 ($1,400,000) ($908,155) $0 9 $0 0% $0 0.00
1073 ($125,000) ($431,971) $387,948 2 $140,561 33% $525,000 1.22
10101 $3,556,000 ($6,488,117) $10,757,504 66 $4,169,575 64% $17,367,772 2.68
10102 $6,506,000 ($12,436,898) $21,596,925 120 $8,743,694 70% $21,772,650 1.75
10112 $1,657,000 ($4,832,184) $8,502,607 48 $2,834,202 59% $8,500,000 1.76
10148 $4,216,000 ($7,624,352) $11,458,902 74 $4,774,542 63% $13,536,200 1.78
14099 $429,000 ($2,778,170) $3,371,290 23 $1,272,185 46% $5,232,000 1.88
Total $14,839,000 ($35,499,848) $56,075,177 342 $21,934,760 62% $66,933,621 1.89
Industry Benchmarks – Deltek Clarity: Architecture & Average 58.5 1.74
rd
Engineering Industry Study 43 Report (2022) Top-Quartile 59.3 2.01
* Net revenue based on budgeted total revenue less pass-thru costs. Marketing only counted in net revenue w/project award.
Estimated backlog at beginning of 2023 is projected to be $32MM = 54% of Total Budgeted 2023 Revenue of $60.5MM
Keys to Success
• Civil Infrastructure: Find additional staff for potential infrastructure projects.
• Government: Win higher revenue percentage of TORNs on existing and new IDIQ contracts.
• Ind./L.S./F&B: Pursue clients that seek value over lowest cost, more negotiated work, and lump-sum vs. T&M.
• Healthcare: Improve utilization, win more work, diversify engineering business to non-healthcare projects.
• Improve efficiency of project execution through wider use of standards and best
practices.
• Assure team members are engaged in training and development opportunities.
Contribution Expansion
• Update rate schedules and pursue more lump sum contracts across all divisions.
• Reduce average hourly personnel costs by hiring more entry-level staff.
6