
Page 4 - D&C Business Plan Summary
P. 4
Design & Consulting Operations – Business Plan Summary
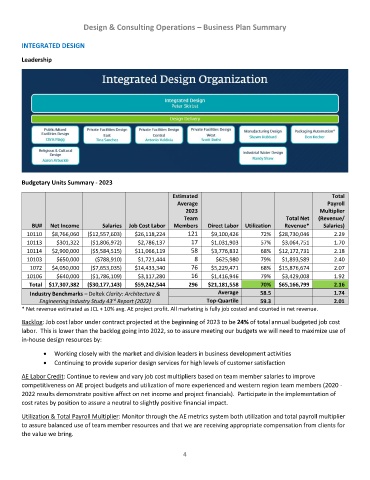
INTEGRATED DESIGN
Leadership
Budgetary Units Summary - 2023
Estimated Total
Average Payroll
2023 Multiplier
Team Total Net (Revenue/
BU# Net Income Salaries Job Cost Labor Members Direct Labor Utilization Revenue* Salaries)
10110 $8,766,060 ($12,557,603) $26,118,224 121 $9,100,426 72% $28,730,046 2.29
10113 $301,322 ($1,806,972) $2,786,137 17 $1,031,903 57% $3,064,751 1.70
10114 $2,900,000 ($5,584,515) $11,066,119 58 $3,776,832 68% $12,172,731 2.18
10103 $650,000 ($788,910) $1,721,444 8 $625,980 79% $1,893,589 2.40
1072 $4,050,000 ($7,653,035) $14,433,340 76 $5,229,471 68% $15,876,674 2.07
10106 $640,000 ($1,786,109) $3,117,280 16 $1,416,946 79% $3,429,008 1.92
Total $17,307,382 ($30,177,143) $59,242,544 296 $21,181,558 70% $65,166,799 2.16
Industry Benchmarks – Deltek Clarity: Architecture & Average 58.5 1.74
rd
Engineering Industry Study 43 Report (2022) Top-Quartile 59.3 2.01
* Net revenue estimated as JCL + 10% avg. AE project profit. All marketing is fully job costed and counted in net revenue.
Backlog: Job cost labor under contract projected at the beginning of 2023 to be 24% of total annual budgeted job cost
labor. This is lower than the backlog going into 2022, so to assure meeting our budgets we will need to maximize use of
in-house design resources by:
• Working closely with the market and division leaders in business development activities
• Continuing to provide superior design services for high levels of customer satisfaction
AE Labor Credit: Continue to review and vary job cost multipliers based on team member salaries to improve
competitiveness on AE project budgets and utilization of more experienced and western region team members (2020 -
2022 results demonstrate positive affect on net income and project financials). Participate in the implementation of
cost rates by position to assure a neutral to slightly positive financial impact.
Utilization & Total Payroll Multiplier: Monitor through the AE metrics system both utilization and total payroll multiplier
to assure balanced use of team member resources and that we are receiving appropriate compensation from clients for
the value we bring.
4