
Page 177 - Servo Motors and Industrial Control Theory -
P. 177
Appendix A 173
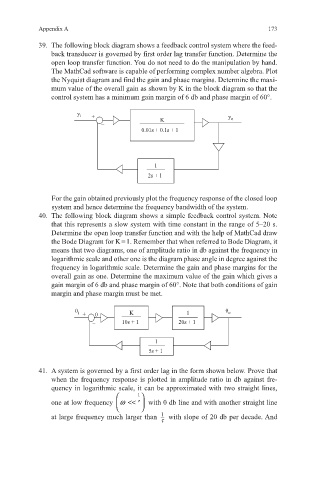
39. The following block diagram shows a feedback control system where the feed-
back transducer is governed by first order lag transfer function. Determine the
open loop transfer function. You do not need to do the manipulation by hand.
The MathCad software is capable of performing complex number algebra. Plot
the Nyquist diagram and find the gain and phase margins. Determine the maxi-
mum value of the overall gain as shown by K in the block diagram so that the
control system has a minimum gain margin of 6 db and phase margin of 60°.
y i + y o
– K
0.01s + 0.1s + 1
1
2s + 1
For the gain obtained previously plot the frequency response of the closed loop
system and hence determine the frequency bandwidth of the system.
40. The following block diagram shows a simple feedback control system. Note
that this represents a slow system with time constant in the range of 5–20 s.
Determine the open loop transfer function and with the help of MathCad draw
the Bode Diagram for K = 1. Remember that when referred to Bode Diagram, it
means that two diagrams, one of amplitude ratio in db against the frequency in
logarithmic scale and other one is the diagram phase angle in degree against the
frequency in logarithmic scale. Determine the gain and phase margins for the
overall gain as one. Determine the maximum value of the gain which gives a
gain margin of 6 db and phase margin of 60°. Note that both conditions of gain
margin and phase margin must be met.
+ θ
θ i K 1 θ o
– 10s + 1 20s + 1
1
5s + 1
41. A system is governed by a first order lag in the form shown below. Prove that
when the frequency response is plotted in amplitude ratio in db against fre-
quency in logarithmic scale, it can be approximated with two straight lines,
1
one at low frequency ω << τ with 0 db line and with another straight line
1
at large frequency much larger than with slope of 20 db per decade. And
τ