
Page 179 - Servo Motors and Industrial Control Theory -
P. 179
Appendix A 175
Find the lag time constant τ so that the system gain margin increases to 6 db.
2
Then find the lead time constant so that the phase margin increases to 60°.
Again use the straight line approximation to correct the system Bode Diagram.
And correct the maximum errors which occurs at the corner frequency (fre-
quency break point).
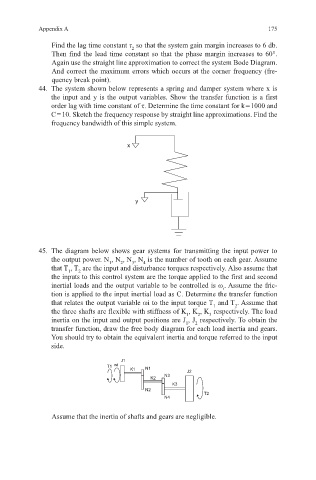
44. The system shown below represents a spring and damper system where x is
the input and y is the output variables. Show the transfer function is a first
order lag with time constant of τ. Determine the time constant for k = 1000 and
C = 10. Sketch the frequency response by straight line approximations. Find the
frequency bandwidth of this simple system.
x
y
45. The diagram below shows gear systems for transmitting the input power to
the output power. N , N , N , N is the number of tooth on each gear. Assume
1
3
2
4
that T , T are the input and disturbance torques respectively. Also assume that
2
1
the inputs to this control system are the torque applied to the first and second
inertial loads and the output variable to be controlled is ω . Assume the fric-
i
tion is applied to the input inertial load as C. Determine the transfer function
that relates the output variable ωi to the input torque T and T . Assume that
1
2
the three shafts are flexible with stiffness of K , K , K respectively. The load
2
3
1
inertia on the input and output positions are J , J respectively. To obtain the
2
1
transfer function, draw the free body diagram for each load inertia and gears.
You should try to obtain the equivalent inertia and torque referred to the input
side.
J1
T1 wi
K1 N1 J2
K2 N3
K3
N2 T2
N4
Assume that the inertia of shafts and gears are negligible.