
Page 15 - Signal & Tele
P. 15
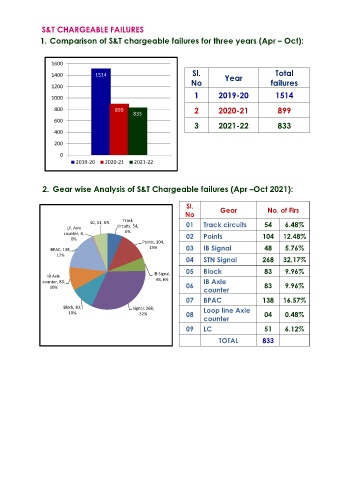
S&T CHARGEABLE FAILURES

               1.  Comparison of S&T chargeable failures for three years (Apr – Oct):


                   1600

                   1400           1514                               Sl.        Year              Total
                                                                    No                          failures
                   1200

                   1000                                              1        2019-20             1514
                    800                  899                         2        2020-21              899
                                                833
                    600
                                                                     3        2021-22              833
                    400

                    200
                      0
                            2019-20   2020-21   2021-22


                2.  Gear wise Analysis of S&T Chargeable failures (Apr –Oct 2021):


                                                                  Sl.         Gear             No. of Flrs
                                                                  No
                                 LC, 51, 6%  Track                01     Track circuits       54     6.48%
                        L/L Axle          circuits, 54,
                       counter, 4,           6%                   02     Points              104    12.48%
                          0%
                                                   Points, 104,
                   BPAC, 138,                        13%          03     IB Signal            48     5.76%
                     17%
                                                                  04     STN Signal          268    32.17%
                                                                  05     Block                83     9.96%
                  IB Axle                              IB Signal,
                counter, 83,                            48, 6%           IB Axle
                   10%                                            06                          83     9.96%
                                                                         counter
                                                                  07     BPAC                138    16.57%
                       Block, 83,               Signal, 268,             Loop line Axle
                         10%                      32%             08                          04     0.48%
                                                                         counter
                                                                  09     LC                   51     6.12%

                                                                              TOTAL          833