
Page 16 - Signal & Tele
P. 16
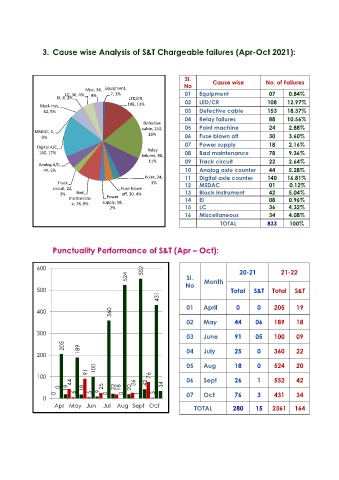
3.  Cause wise Analysis of S&T Chargeable failures (Apr-Oct 2021):


                                                                  Sl.
                                                                  No        Cause wise        No. of Failures
                               Misc, 34,   Equipment,
                        LC, 36, 4%  4%  7, 1%                     01   Equipment               07     0.84%
                     EI, 8, 1%                LED/CR,
               Block inst,                    108, 13%            02   LED/CR                  108    12.97%
                42, 5%                                            03   Defective cable         153    18.37%
                                                                  04   Relay failures          88     10.56%
                                                   Defective
                                                   cable, 153,    05   Point machine           24     2.88%
             MSDAC, 1,                               18%
                0%                                                06   Fuse blown off          30     3.60%
                                                                  07   Power supply            18     2.16%
              Digital A/C,                           Relay
               140, 17%                                           08   Bad maintenance         78     9.36%
                                                   failures, 88,
                                                     11%          09   Track circuit           22     2.64%
               Analog A/C,
                44, 5%                                            10   Analog axle counter     44     5.28%
                                                    Point, 24,    11   Digital axle counter    140    16.81%
                     Track                            3%          12   MSDAC                   01      0.12%
                    circuit, 22,            Fuse blown
                      3%    Bad             off, 30, 4%           13   Block instrument        42     5.04%
                         maintenanc    Power                      14   EI                      08     0.96%
                          e, 78, 9%  supply, 18,
                                        2%                        15   LC                      36     4.32%
                                                                  16   Miscellaneous           34     4.08%
                                                                              TOTAL            833     100%


                    Punctuality Performance of S&T (Apr – Oct):


              600                                  552                               20-21          21-22
                                              524                  Sl.
                                                                  No     Month
              500                                                                 Total   S&T    Total   S&T
                                                         431
                                                                  01     April      0      0     205     19
              400                       360
                                                                  02     May       44      06    189     18
              300
                                                                  03     June      91      05    100     09
                       205   189
              200                                                 04     July      25      0     360     22

                                   100                            05     Aug       18      0     524     20
                                91
              100                                     76
                          44                     26  42           06     Sept      26      1     552     42
                      0  19   18     25  22  18  20       34
                     0      6    5  9  0    0     1    3          07     Oct       76      3     431     34
                0
                    Apr May Jun      Jul  Aug Sept Oct
                                                                     TOTAL         280     15    2361   164