
Page 273 - SKU-000506274_TEXT.indd
P. 273
252 Part IV Promotion and Monetization
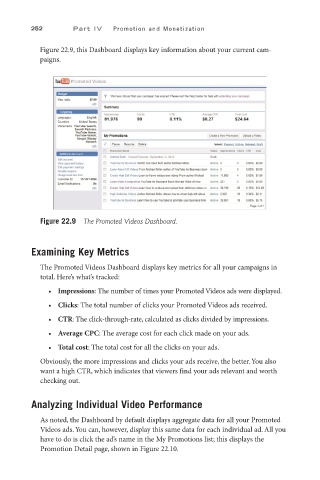
Figure 22.9, this Dashboard displays key information about your current cam-
paigns.
Figure 22.9 The Promoted Videos Dashboard.
Examining Key Metrics
The Promoted Videos Dashboard displays key metrics for all your campaigns in
total. Here’s what’s tracked:
• Impressions: The number of times your Promoted Videos ads were displayed.
• Clicks: The total number of clicks your Promoted Videos ads received.
• CTR: The click-through-rate, calculated as clicks divided by impressions.
• Average CPC: The average cost for each click made on your ads.
• Total cost: The total cost for all the clicks on your ads.
Obviously, the more impressions and clicks your ads receive, the better. You also
want a high CTR, which indicates that viewers find your ads relevant and worth
checking out.
Analyzing Individual Video Performance
As noted, the Dashboard by default displays aggregate data for all your Promoted
Videos ads. You can, however, display this same data for each individual ad. All you
have to do is click the ad’s name in the My Promotions list; this displays the
Promotion Detail page, shown in Figure 22.10.