
Page 59 - Analytical Chemistry I E-book
P. 59
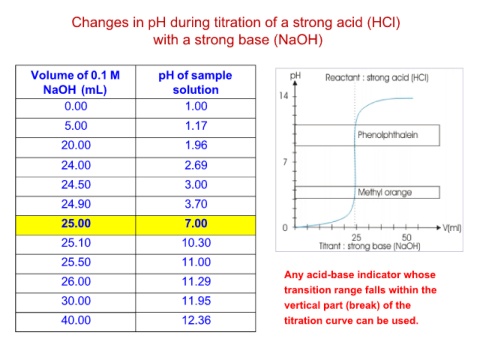
Changes in pH during titration of a strong acid (HCl)
                 with a strong base (NaOH)

Volume of 0.1 M  pH of sample  Any acid-base indicator whose
   NaOH (mL)        solution   transition range falls within the
        0.00           1.00    vertical part (break) of the
        5.00           1.17    titration curve can be used.
       20.00           1.96

       24.00           2.69
       24.50           3.00
       24.90           3.70
       25.00           7.00
       25.10          10.30
       25.50          11.00
       26.00          11.29
       30.00          11.95
       40.00          12.36