
Page 16 - Process_Book_Cheryl_Brewster
P. 16
2. Understanding - Research
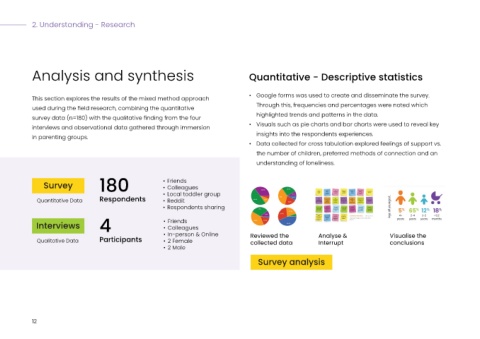
Analysis and synthesis Quantitative - Descriptive statistics
• Google forms was used to create and disseminate the survey.
This section explores the results of the mixed method approach
Through this, frequencies and percentages were noted which
used during the field research, combining the quantitative
highlighted trends and patterns in the data.
survey data (n=180) with the qualitative finding from the four
• Visuals such as pie charts and bar charts were used to reveal key
interviews and observational data gathered through immersion
insights into the respondents experiences.
in parenting groups.
• Data collected for cross tabulation explored feelings of support vs.
the number of children, preferred methods of connection and an
understanding of loneliness.
Survey 180 • Friends
• Colleagues
• Local toddler group
Quantitative Data Respondents • Reddit
• Respondents sharing
Interviews 4 • Friends
• Colleagues
• In-person & Online Reviewed the Analyse & Visualise the
Qualitative Data Participants • 2 Female collected data Interrupt conclusions
• 2 Male
Survey analysis
12