
Page 703 - Binder2
P. 703
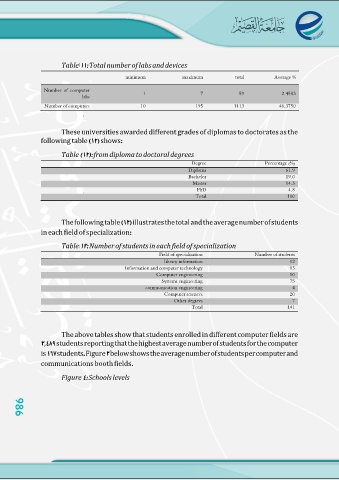
Table Total number of labs and devices

                                 minimum  maximum                                                   total Average %

     Number of computer          1           7 59                                                   2.4583
                           labs
                                 10          195 1113                                               46.3750
     Number of computers

             These universities awarded different grades of diplomas to doctorates as the
     following table shows

     Table                       from diploma to doctoral degrees

                                                                                          Degree    Percentage (%)
                                                                                         Diploma                61.9
                                                                                         Bachelor               19.0
                                                                                                                14.3
                                                                                           Master                4.8
                                                                                              PhD                100
                                                                                             Total

             Thefollowing table illustratesthetotalandtheaveragenumberofstudents
     in each field of specialization

     Table  Number of students in each field of specialization

                                                     Field of specialization                        Number of students
                                                        library information                                             12
                                                                                                                        13
                                 Information and computer technology                                                    10
                                                   Computer engineering                                                 75
                                                      Systems engineering                                                 4
                                                                                                                        20
                                             communication engineering                                                    7
                                                        Computer sciences                                              141
                                                              Other degrees
                                                                        Total

             The above tables show that students enrolled in different computer fields are
      , students reportingthatthehighestaveragenumberofstudentsforthecomputer
     is students Figure belowshowstheaveragenumberofstudentspercomputerand
     communications booth fields

             Figure Schools levels

986

986