Page 702 - Binder2
P. 702

2030

                                                              Users                               Percentage of users
                                             Community groups                                                     4.3%
                                                                                                                 13.0%
                                                  School children                                                 8.7%
                                                  School teachers                                                 4.3%
                              Students and community groups                                                      43.5%
                                           Students and teachers                                                 26.1%
                          Students, teachers, and communities                                                    100.0

                                                               Total

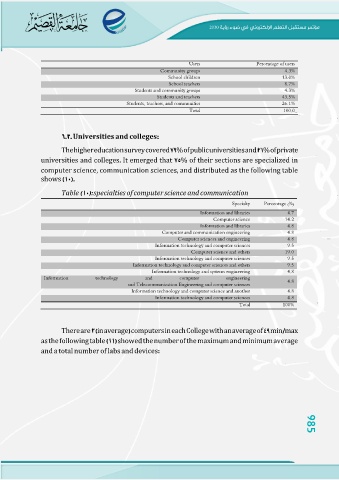
Universities and colleges

        Thehighereducationsurveycovered %ofpublicuniversitiesand %ofprivate
universities and colleges It emerged that % of their sections are specialized in
computer science, communication sciences, and distributed as the following table
shows

       Table  specialties of computer science and communication

Information   technology                                                               Specialty  Percentage (%)
                                                                    Information and libraries                  4.7
                                                                                                              14.2
                                                                            Computer science                   4.8
                                                                    Information and libraries                  4.8
                                              Computer and communication engineering                           4.8
                                                       Computer sciences and engineering                       9.5
                                          Information technology and computer sciences                        19.0
                                                               Computer science and others                     9.5
                                          Information technology and computer sciences                         9.5
                             Information technology and computer sciences and others                           4.8
                                        Information technology and systems engineering                         4.8
                                    and computer engineering                                                   4.8
                          and Telecommunication Engineering and computer sciences                              4.8
                            Information technology and computer science and another
                                          Information technology and computer sciences                       100%

                                                                                           Total

        Thereare inaverage computersineachCollegewithanaverageof min max
asthe following table showedthe numberof the maximumandminimumaverage
and a total number of labs and devices

                                                                                                                        985
   697   698   699   700   701   702   703   704   705   706   707