Page 699 - Binder2
P. 699

and personal training effort
     Other
     Total

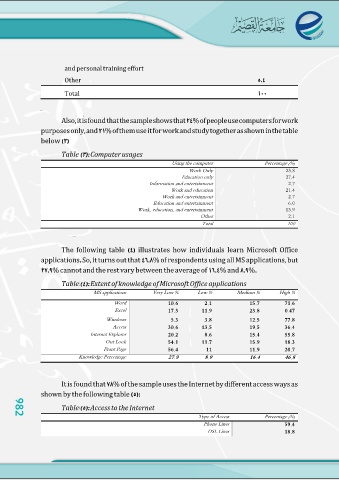
             Also,itisfoundthatthesampleshowsthat %ofpeopleusecomputersforwork
     purposesonly,and %ofthemuseitforworkandstudytogetherasshowninthetable
     below

     Table  Computer usages

                                                         Using the computer                Percentage (%)
                                                                   Work Only                           23.8
                                                                                                       27.4
                                                               Education only                            2.7
                                             Information and entertainment                             21.4
                                                                                                         2.7
                                                        Work and education                               6.0
                                                    Work and entertainment                             13.9
                                               Education and entertainment                               2.1
                                      Work, education, and entertainment                               100

                                                                         Other
                                                                          Total

             The following table illustrates how individuals learn Microsoft Office
     applications So, it turns out that % of respondents using all MS applications, but

         % cannot and the rest vary between the average of % and %

     Table Extent of knowledge of Microsoft Office applications

            MS applications        Very Low %  Low %                             Medium %  High %

                        Word       10.6 2.1                                      15.7        71.6
                         Excel     17.3 11.9                                     23.8        0.47
                    Windows                                                                  77.8
                        Access      5.3 3.8                                      12.5        36.4
           Internet Explorer       30.6 13.5                                     19.5        55.8
                    Out Look       20.2 8.6                                      15.4        18.3
                   Front Page      54.1 11.7                                     15.9        20.7
     Knowledge Percentage          56.4 11                                       11.9        46.8
                                   27.9 8.9                                      16.4

982          It is found that % of the sample uses the Internet by different access ways as
     shown by the following table

     Table Access to the Internet

                                               Type of Access                              Percentage (%)
                                                  Phone Lines                                        59.4
                                                    DSL Lines
                                                                                                     18.8

982
   694   695   696   697   698   699   700   701   702   703   704