
Page 20 - TCL International VILLETA BUSINESS PLAN AND FEASABILITY STUDY
P. 20
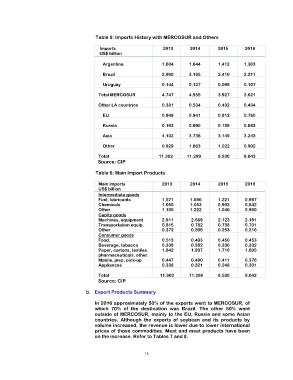
Table 5: Imports History with MERCOSUR and Others

                                            Imports                      2013         2014         2015        2016
                                            US$ billion

                                               Argentina                1.604        1.644         1.412       1.303

                                               Brazil                   2.999        3.165         2.416       2.211

                                               Uruguay                  0.144        0.127         0.098       0.107

                                           Total MERCOSUR               4.747        4.935         3.927       3.621

                                           Other LA countries           0.381        0.534         0.432       0.434

                                               EU                       0.949        0.941         0.812       0.760

                                               Russia                   0.193        0.090         0.189       0.083

                                               Asia                     4.102        3.736         3.149       3.243

                                               Other                    0.929        1.063         1.022       0.902

                                           Total                     11.302      11.299         9.530       9.043
                                                  Source: CIP

                                                Table 6: Main Import Products

                                           Main imports                 2013         2014         2015        2016
                                           US$ billion
                                           Intermediate goods
                                           Fuel, lubricants             1.571         1.696         1.221        0.987
                                           Chemicals                    1.050         1.053         0.992        0.842
                                           Other                        1.105         1.222         1.046        0.960
                                           Capita goods
                                           Machines, equipment          2.911          2.569          2.123        2.181
                                           Transportation equip.         0.815          0.782         0.738        0.701
                                           Other                        0.372          0.396         0.253        0.216
                                           Consumer goods
                                           Food,                        0.513          0.493         0.450        0.453
                                           Beverage, tobacco            0.338          0.382         0.336        0.332
                                           Paper, cartons, textiles.         1.842          1.897         1.710        1.695
                                           pharmaceuticals, other.
                                           Mobile, jeep, pick-up         0.447          0.490         0.411        0.376
                                           Appliances                   0.338          0.321         0.248        0.301

                                           Total                      11.302        11.299         9.530        9.042
                                                                 Source: CIP

                                     b.  Export Products Summary

                                         In 2016 approximately 50% of the exports went to MERCOSUR, of
                                         which  70%  of  the  destination  was  Brazil.  The  other  50%  went
                                         outside of MERCOSUR, mainly to the EU, Russia and some Asian
                                         countries.  Although  the  exports  of  soybean  and  its  products  by
                                         volume increased, the revenue is lower due to lower international
                                         prices of those commodities. Meat  and meat products have been
                                         on the increase. Refer to Tables 7 and 8.


                                                             15