Page 19 - TCL International VILLETA BUSINESS PLAN AND FEASABILITY STUDY
P. 19

•     Rediex stated in October 2016 that 116 foreign companies installed
                                         manufacturing facilities in Paraguay in the last 3 years, 80% of them
                                         are Brazilian.

                          As consequence imports by containers have increased over the years. Expensive
                          goods such as electronics, appliances, electrical items, fertilizers, etc. must be
                          imported  via  containers.  In  addition,  exports  of  grain  by  containers  are  on  the
                          increase and, of course, all grades of meat and related products are shipped that
                          way.

                              A.  Annual Trade History

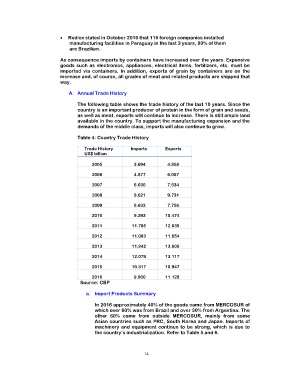
                                 The following table shows the trade history of the last 10 years. Since the
                                 country is an important producer of protein in the form of grain and seeds,
                                 as well as meat, exports will continue to increase. There is still ample land
                                 available in the country. To support the manufacturing expansion and the
                                 demands of the middle class, imports will also continue to grow.

                                 Table 4: Country Trade History

                                      Trade History        Imports        Exports
                                      US$ billion

                                             2005            3.694          4.858

                                             2006            4.877          6.007

                                             2007            6.030          7.534

                                             2008            8.621          9.731

                                             2009            6.632          7.756

                                             2010            9.293        10.474

                                             2011          11.785        12.639

                                             2012          11.083        11.654

                                             2013          11.942        13.605

                                             2014          12.079        13.117

                                             2015          10.317        10.947

                                             2016            9.900        11.128
                                                  Source: CBP

                                     a.  Import Products Summary

                                         In 2016 approximately 40% of the goods came from MERCOSUR of
                                         which over 60% was from Brazil and over 30% from Argentina. The
                                         other  60%  came  from  outside  MERCOSUR,  mainly  from  some
                                         Asian countries such as PRC, South Korea and Japan. Imports of
                                         machinery and equipment continue to be strong, which  is due to
                                         the country’s industrialization. Refer to Table 5 and 6.


                                                             14
   14   15   16   17   18   19   20   21   22   23   24