Page 21 - TCL International VILLETA BUSINESS PLAN AND FEASABILITY STUDY
P. 21

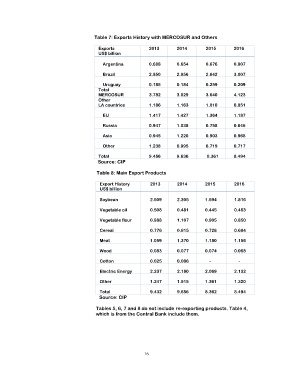
Table 7: Exports History with MERCOSUR and Others

                                           Exports                 2013         2014         2015        2016
                                           US$ billion

                                               Argentina           0.688         0.654         0.676        0.907

                                               Brazil              2.850         2.956         2.642        3.007

                                               Uruguay             0.185         0.184         0.259        0.209
                                           Total
                                           MERCOSUR                3.782         3.829         3.640        4.123
                                           Other
                                           LA countries            1.186         1.163         1.010        0.851

                                               EU                  1.417         1.427         1.364        1.187

                                               Russia              0.947         1.038         0.758        0.646

                                               Asia                0.945         1.220         0.903        0.968

                                               Other               1.238         0.995         0.719        0.717

                                           Total                   9.456         9.636          8.361        8.494
                                                  Source: CIP

                                                 Table 8: Main Export Products

                                           Export History           2013         2014         2015        2016
                                           US$ billion

                                           Soybean                  2.509         2.305         1.594        1.816

                                           Vegetable oil            0.508         0.481         0.445        0.463

                                           Vegetable flour          0.988         1.107         0.905        0.850

                                           Cereal                   0.776         0.615         0.728        0.684

                                           Meat                     1.059         1.370         1.180        1.156

                                           Wood                     0.083         0.077         0.074        0.068

                                           Cotton                   0.025         0.006             -            -

                                           Electric Energy          2.237         2.180         2.069        2.132

                                           Other                    1.247         1.515         1.361        1.320

                                           Total                    9.432         9.656         8.362        8.494
                                                                  Source: CIP

                                                               Tables 5, 6, 7 and 8 do not include re-exporting products. Table 4,
                                                               which is from the Central Bank include them.


                                                             16
   16   17   18   19   20   21   22   23   24   25   26