Page 22 - TCL International VILLETA BUSINESS PLAN AND FEASABILITY STUDY
P. 22

B.  Main Import Products

                                     a.  Containers

                                         Container imports are on the increase and follow the expand in the
                                         economy.  It  is  estimated  that  at  present,  over  12,000  containers
                                         are imported monthly.

                                         The  exact  amount  is  not  known  because  imports  and  exports  of
                                         general cargo by containers are documented by the total weight.
                                         Since  the  import  goods  are  generally  expensive  items,  it  is
                                         assumed that most of them come by containers.

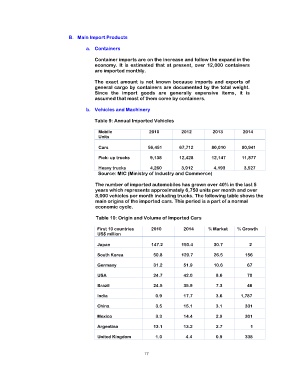
                                     b.  Vehicles and Machinery

                                                              Table 9: Annual Imported Vehicles

                                           Mobile                  2010         2012         2013        2014
                                           Units

                                           Cars                   56,451       67,712       80,010       80,941

                                           Pick- up trucks          9,138       12,428       12,147       11,877

                                           Heavy trucks             4,260         3,912         4,193         3,527
                                                                 Source: MIC (Ministry of Industry and Commerce)

                                                             The number of imported automobiles has grown over 40% in the last 5
                                                             years which represents approximately 6,750 units per month and over
                                                             8,000 vehicles per month including trucks. The following table shows the
                                                             main origins of the imported cars. This period is a part of a normal
                                                             economic cycle.

                                                               Table 10: Origin and Volume of Imported Cars

                                          First 10 countries         2010         2014    % Market   % Growth
                                          US$ million

                                          Japan                    147.2       150.4          30.7              2

                                          South Korea                50.8       129.7         26.5          156

                                          Germany                    31.2         51.9         10.6            67

                                          USA                        24.7         42.0           8.6            70

                                          Brazil                     24.5         35.9           7.3            46

                                          India                        0.9         17.7           3.6      1,787

                                          China                        3.5         15.1           3.1          331

                                          Mexico                       3.3         14.4           2.9          301

                                          Argentina                  13.1         13.2           2.7               1

                                          United Kingdom               1.0           4.4           0.9          338


                                                             17
   17   18   19   20   21   22   23   24   25   26   27