
Page 145 - DUOKOPT BIBLIOBOOK
P. 145
EFFICACY
Acta Ophthalmologica 2010
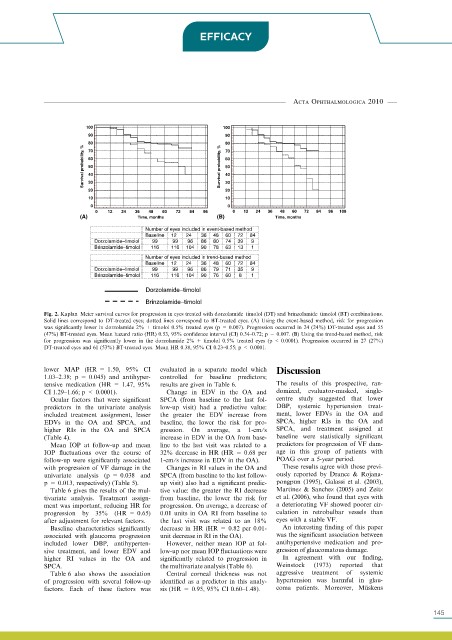
Fig. 2. Kaplan–Meier survival curves for progression in eyes treated with dorzolamide–timolol (DT) and brinzolamide–timolol (BT) combinations.
Solid lines correspond to DT-treated eyes; dotted lines correspond to BT-treated eyes. (A) Using the event-based method, risk for progression
was significantly lower in dorzolamide 2% + timolol 0.5% treated eyes (p = 0.007). Progression occurred in 24 (24%) DT-treated eyes and 55
(47%) BT-treated eyes. Mean hazard ratio (HR) 0.53, 95% confidence interval (CI) 0.34–0.72; p = 0.007. (B) Using the trend-based method, risk
for progression was significantly lower in the dorzolamide 2% + timolol 0.5% treated eyes (p < 0.0001). Progression occurred in 27 (27%)
DT-treated eyes and 61 (53%) BT-treated eyes. Mean HR 0.38, 95% CI 0.23–0.55; p < 0.0001.
lower MAP (HR = 1.50, 95% CI evaluated in a separate model which Discussion
1.03–2.38; p = 0.045) and antihyper- controlled for baseline predictors;
tensive medication (HR = 1.47, 95% results are given in Table 6. The results of this prospective, ran-
CI 1.29–1.66; p < 0.0001). Change in EDV in the OA and domized, evaluator-masked, single-
Ocular factors that were significant SPCA (from baseline to the last fol- centre study suggested that lower
predictors in the univariate analysis low-up visit) had a predictive value: DBP, systemic hypertension treat-
included treatment assignment, lesser the greater the EDV increase from ment, lower EDVs in the OA and
EDVs in the OA and SPCA, and baseline, the lower the risk for pro- SPCA, higher RIs in the OA and
higher RIs in the OA and SPCA gression. On average, a 1-cm⁄ s SPCA, and treatment assigned at
(Table 4). increase in EDV in the OA from base- baseline were statistically significant
Mean IOP at follow-up and mean line to the last visit was related to a predictors for progression of VF dam-
IOP fluctuations over the course of 32% decrease in HR (HR = 0.68 per age in this group of patients with
follow-up were significantly associated 1-cm ⁄s increase in EDV in the OA). POAG over a 5-year period.
with progression of VF damage in the Changes in RI values in the OA and These results agree with those previ-
univariate analysis (p = 0.038 and SPCA (from baseline to the last follow- ously reported by Drance & Rojana-
p = 0.013, respectively) (Table 5). up visit) also had a significant predic- pongpun (1995), Galassi et al. (2003),
Table 6 gives the results of the mul- tive value: the greater the RI decrease Martinez & Sanchez (2005) and Zeitz
tivariate analysis. Treatment assign- from baseline, the lower the risk for et al. (2006), who found that eyes with
ment was important, reducing HR for progression. On average, a decrease of a deteriorating VF showed poorer cir-
progression by 35% (HR = 0.65) 0.01 units in OA RI from baseline to culation in retrobulbar vessels than
after adjustment for relevant factors. the last visit was related to an 18% eyes with a stable VF.
Baseline characteristics significantly decrease in HR (HR = 0.82 per 0.01- An interesting finding of this paper
associated with glaucoma progression unit decrease in RI in the OA). was the significant association between
included lower DBP, antihyperten- However, neither mean IOP at fol- antihypertensive medication and pro-
sive treatment, and lower EDV and low-up nor mean IOP fluctuations were gression of glaucomatous damage.
higher RI values in the OA and significantly related to progression in In agreement with our finding,
SPCA. the multivariate analysis (Table 6). Weinstock (1973) reported that
Table 6 also shows the association Central corneal thickness was not aggressive treatment of systemic
of progression with several follow-up identified as a predictor in this analy- hypertension was harmful in glau-
factors. Each of these factors was sis (HR = 0.95, 95% CI 0.60–1.48). coma patients. Moreover, Mu ¨ skens
547 145