
Page 148 - DUOKOPT BIBLIOBOOK
P. 148
DUOKOPT - bibliography book - CONFIDENTIAL - document for exclusive use by personnel of Laboratoires Théa – DO NOT DISTRIBUTE
®
Acta Ophthalmologica 2010
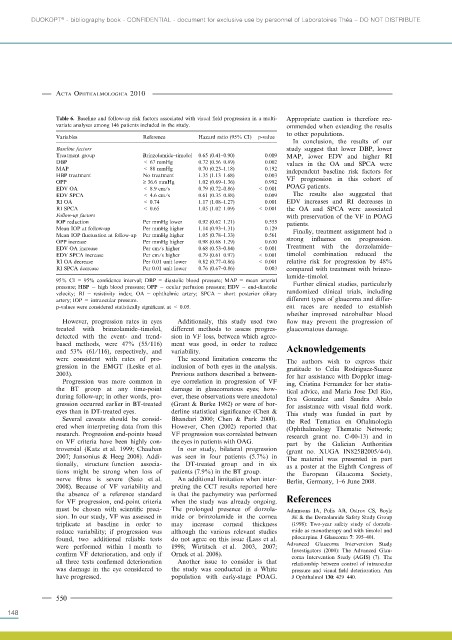
Table 6. Baseline and follow-up risk factors associated with visual field progression in a multi- Appropriate caution is therefore rec-
variate analyses among 146 patients included in the study. ommended when extending the results
to other populations.
Variables Reference Hazard ratio (95% CI) p-value
In conclusion, the results of our
Baseline factors study suggest that lower DBP, lower
Treatment group Brinzolamide–timolol 0.65 (0.41–0.90) 0.009 MAP, lower EDV and higher RI
DBP < 67 mmHg 0.72 (0.56–0.89) 0.002 values in the OA and SPCA were
MAP < 88 mmHg 0.70 (0.23–1.18) 0.192 independent baseline risk factors for
HBP treatment No treatment 1.35 (1.13–1.68) 0.003
OPP ‡ 36.6 mmHg 1.02 (0.69–1.36) 0.992 VF progression in this cohort of
EDV OA < 8.9 cm ⁄ s 0.79 (0.72–0.86) < 0.001 POAG patients.
EDV SPCA < 4.6 cm ⁄ s 0.61 (0.35–0.88) 0.009 The results also suggested that
RI OA < 0.74 1.17 (1.08–1.27) 0.001 EDV increases and RI decreases in
RI SPCA < 0.65 1.05 (1.02–1.09) < 0.001 the OA and SPCA were associated
Follow-up factors with preservation of the VF in POAG
IOP reduction Per mmHg lower 0.92 (0.62–1.21) 0.555 patients.
Mean IOP at follow-up Per mmHg higher 1.14 (0.93–1.31) 0.129 Finally, treatment assignment had a
Mean IOP fluctuation at follow-up Per mmHg higher 1.05 (0.78–1.33) 0.561
OPP increase Per mmHg higher 0.98 (0.68–1.29) 0.630 strong influence on progression.
EDV OA increase Per cm ⁄ s higher 0.68 (0.53–0.84) < 0.001 Treatment with the dorzolamide–
EDV SPCA increase Per cm ⁄ s higher 0.79 (0.61–0.97) < 0.001 timolol combination reduced the
RI OA decrease Per 0.01 unit lower 0.82 (0.77–0.86) < 0.001 relative risk for progression by 48%
RI SPCA decrease Per 0.01 unit lower 0.76 (0.67–0.86) 0.003 compared with treatment with brinzo-
lamide–timolol.
95% CI = 95% confidence interval; DBP = diastolic blood pressure; MAP = mean arterial
pressure; HBP = high blood pressure; OPP = ocular perfusion pressure; EDV = end-diastolic Further clinical studies, particularly
velocity; RI = resistivity index; OA = ophthalmic artery; SPCA = short posterior ciliary randomized clinical trials, including
artery; IOP = intraocular pressure. different types of glaucoma and differ-
p-values were considered statistically significant at < 0.05. ent races are needed to establish
whether improved retrobulbar blood
However, progression rates in eyes Additionally, this study used two flow may prevent the progression of
treated with brinzolamide–timolol, different methods to assess progres- glaucomatous damage.
detected with the event- and trend- sion in VF loss, between which agree-
based methods, were 47% (55⁄ 116) ment was good, in order to reduce
and 53% (61⁄ 116), respectively, and variability. Acknowledgements
were consistent with rates of pro- The second limitation concerns the The authors wish to express their
gression in the EMGT (Leske et al. inclusion of both eyes in the analysis. gratitude to Celia Rodriguez-Suarez
2003). Previous authors described a between- for her assistance with Doppler imag-
Progression was more common in eye correlation in progression of VF ing, Cristina Fernandez for her statis-
the BT group at any time-point damage in glaucomatous eyes; how- tical advice, and Maria Jose Del Rio,
during follow-up; in other words, pro- ever, these observations were anecdotal Eva Gonzalez and Sandra Abalo
gression occurred earlier in BT-treated (Grant & Burke 1982) or were of bor- for assistance with visual field work.
eyes than in DT-treated eyes. derline statistical significance (Chen & This study was funded in part by
Several caveats should be consid- Bhandari 2000; Chen & Park 2000). the Red Tematica en Oftalmologı´a
ered when interpreting data from this However, Chen (2002) reported that (Ophthalmology Thematic Network;
research. Progression end-points based VF progression was correlated between research grant no. C-00-13) and in
on VF criteria have been highly con- the eyes in patients with OAG. part by the Galician Authorities
troversial (Katz et al. 1999; Chauhan In our study, bilateral progression (grant no. XUGA IN825B2005 ⁄4-0).
2007; Jansonius & Heeg 2008). Addi- was seen in four patients (5.7%) in The material was presented in part
tionally, structure–function associa- the DT-treated group and in six as a poster at the Eighth Congress of
tions might be strong when loss of patients (7.9%) in the BT group. the European Glaucoma Society,
nerve fibres is severe (Sato et al. An additional limitation when inter- Berlin, Germany, 1–6 June 2008.
2008). Because of VF variability and preting the CCT results reported here
the absence of a reference standard is that the pachymetry was performed
for VF progression, end-point criteria when the study was already ongoing. References
must be chosen with scientific preci- The prolonged presence of dorzola- Adamsons IA, Polis AB, Ostrov CS, Boyle
sion. In our study, VF was assessed in mide or brinzolamide in the cornea JE & the Dorzolamide Safety Study Group
triplicate at baseline in order to may increase corneal thickness (1998): Two-year safety study of dorzola-
reduce variability; if progression was although the various relevant studies mide as monotherapy and with timolol and
found, two additional reliable tests do not agree on this issue (Lass et al. pilocarpine. J Glaucoma 7: 395–401.
were performed within 1 month to 1998; Wirtitsch et al. 2003, 2007; Advanced Glaucoma Intervention Study
Investigators (2000): The Advanced Glau-
confirm VF deterioration, and only if Ornek et al. 2008).
coma Intervention Study (AGIS) (7). The
all three tests confirmed deterioration Another issue to consider is that relationship between control of intraocular
was damage in the eye considered to the study was conducted in a White pressure and visual field deterioration. Am
have progressed. population with early-stage POAG. J Ophthalmol 130: 429–440.
550
148