
Page 146 - DUOKOPT BIBLIOBOOK
P. 146
DUOKOPT - bibliography book - CONFIDENTIAL - document for exclusive use by personnel of Laboratoires Théa – DO NOT DISTRIBUTE
®
Acta Ophthalmologica 2010
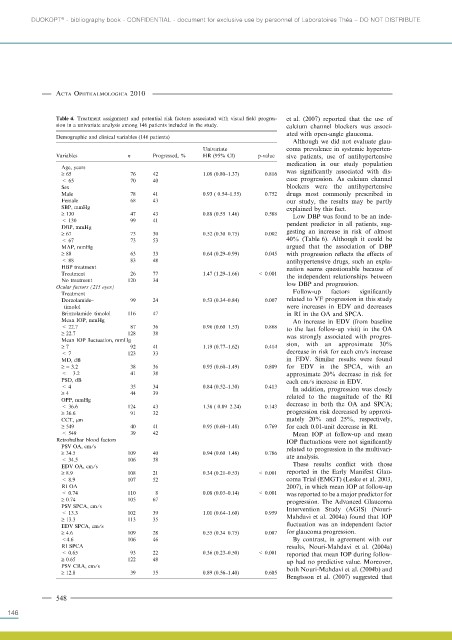
Table 4. Treatment assignment and potential risk factors associated with visual field progres- et al. (2007) reported that the use of
sion in a univariate analysis among 146 patients included in the study. calcium channel blockers was associ-
ated with open-angle glaucoma.
Demographic and clinical variables (146 patients)
Although we did not evaluate glau-
Univariate coma prevalence in systemic hyperten-
Variables n Progressed, % HR (95% CI) p-value sive patients, use of antihypertensive
medication in our study population
Age, years
‡ 65 76 42 1.08 (0.80–1.37) 0.816 was significantly associated with dis-
< 65 70 40 ease progression. As calcium channel
Sex blockers were the antihypertensive
Male 78 41 0.93 ( 0.54–1.55) 0.752 drugs most commonly prescribed in
Female 68 43 our study, the results may be partly
SBP, mmHg explained by this fact.
‡ 130 47 43 0.88 (0.55–1.46) 0.588 Low DBP was found to be an inde-
< 130 99 41
DBP, mmHg pendent predictor in all patients, sug-
‡ 67 73 30 0.52 (0.30–0.75) 0.002 gesting an increase in risk of almost
< 67 73 53 40% (Table 6). Although it could be
MAP, mmHg argued that the association of DBP
‡ 88 63 33 0.64 (0.29–0.99) 0.045 with progression reflects the effects of
< 88 83 48 antihypertensive drugs, such an expla-
HBP treatment nation seems questionable because of
Treatment 26 77 1.47 (1.29–1.66) < 0.001 the independent relationships between
No treatment 120 34
Ocular factors (215 eyes) low DBP and progression.
Treatment Follow-up factors significantly
Dorzolamide– 99 24 0.53 (0.34–0.84) 0.007 related to VF progression in this study
timolol were increases in EDV and decreases
Brinzolamide–timolol 116 47 in RI in the OA and SPCA.
Mean IOP, mmHg An increase in EDV (from baseline
< 22.7 87 36 0.96 (0.60–1.53) 0.868 to the last follow-up visit) in the OA
‡ 22.7 128 38 was strongly associated with progres-
Mean IOP fluctuation, mmHg
‡ 7 92 41 1.19 (0.77–1.62) 0.414 sion, with an approximate 30%
< 7 123 33 decrease in risk for each cm ⁄s increase
MD, dB in EDV. Similar results were found
‡ ) 3.2 38 36 0.95 (0.60–1.49) 0.809 for EDV in the SPCA, with an
< – 3.2 41 38 approximate 20% decrease in risk for
PSD, dB each cm⁄ s increase in EDV.
< 4 35 34 0.84 (0.52–1.30) 0.413 In addition, progression was closely
‡ 4 44 39
OPP, mmHg related to the magnitude of the RI
< 36.6 124 43 1.38 ( 0.89–2.24) 0.143 decrease in both the OA and SPCA;
‡ 36.6 91 32 progression risk decreased by approxi-
CCT, lm mately 20% and 25%, respectively,
‡ 549 40 41 0.95 (0.60–1.48) 0.769 for each 0.01-unit decrease in RI.
< 549 39 42 Mean IOP at follow-up and mean
Retrobulbar blood factors IOP fluctuations were not significantly
PSV OA, cm ⁄ s related to progression in the multivari-
‡ 34.5 109 40 0.94 (0.60–1.48) 0.786
< 34.5 106 38 ate analysis.
EDV OA, cm ⁄ s These results conflict with those
‡ 8.9 108 21 0.34 (0.21–0.53) < 0.001 reported in the Early Manifest Glau-
< 8.9 107 52 coma Trial (EMGT) (Leske et al. 2003,
RI OA 2007), in which mean IOP at follow-up
< 0.74 110 8 0.08 (0.03–0.14) < 0.001 was reported to be a major predictor for
‡ 0.74 105 67 progression. The Advanced Glaucoma
PSV SPCA, cm ⁄ s Intervention Study (AGIS) (Nouri-
< 13.3 102 39 1.01 (0.64–1.60) 0.959
‡ 13.3 113 35 Mahdavi et al. 2004a) found that IOP
EDV SPCA, cm ⁄ s fluctuation was an independent factor
‡ 4.6 109 28 0.55 (0.34–0.75) 0.007 for glaucoma progression.
<4.6 106 46 By contrast, in agreement with our
RI SPCA results, Nouri-Mahdavi et al. (2004a)
< 0.65 93 22 0.36 (0.23–0.50) < 0.001 reported that mean IOP during follow-
‡ 0.65 122 48 up had no predictive value. Moreover,
PSV CRA, cm ⁄ s both Nouri-Mahdavi et al. (2004b) and
‡ 12.8 39 35 0.89 (0.56–1.40) 0.605
Bengtsson et al. (2007) suggested that
548
146