
Page 185 - Atlas of Small Animal CT and MRI
P. 185
Trauma, Hemorrhage, and Vascular Disorders 175
Nonhemorrhagic infarction may appear mildly T1 corresponding apparent diffusion coefficient (ADC)
14
hypointense and T2 hyperintense with variable mass maps. Perfusion images may define specific regions of
effect involving both gray and white matter on unenhanced perfusion deficit, and magnetic resonance angiographic
MR images (Figure 2.4.11). Due to restricted water (MRA) images can reveal relative or absolute flow deficits
diffusion, ischemic regions of the brain will appear hyper- in affected vessels. 14,17,20 Gradient echo T2* images will
intense on diffusion‐weighted images and hypointense on display relatively little or no susceptibility effect.
Table 2.4.1 MR staging of intracranial hemorrhage.
Phase Time Compartment Hemoglobin product T1 T2
Hyperacute <24 hours Intracellular Oxyhemoglobin isointense hyperintense
Acute 1–3 days Intracellular Deoxyhemoglobin iso‐ to hypointense hypointense
Early subacute >3 days Intracellular Methemoglobin hyperintense hypointense
Late subacute >7 days Extracellular Methemoglobin hyperintense hyperintense
Chronic >14 days Extracellular Hemosiderin hypointense hypointense
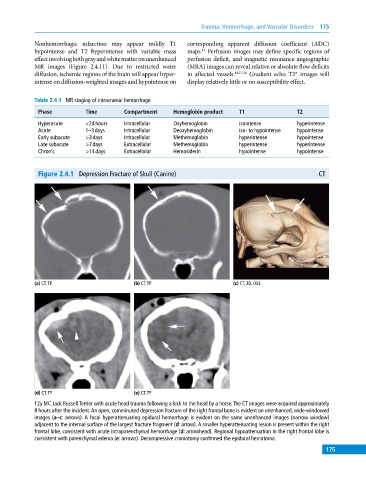
Figure 2.4.1 Depression Fracture of Skull (Canine) CT
(a) CT, TP (b) CT, TP (c) CT, 3D, OBL
(d) CT, TP (e) CT, TP
12y MC Jack Russell Terrier with acute head trauma following a kick to the head by a horse. The CT images were acquired approximately
8 hours after the incident. An open, comminuted depression fracture of the right frontal bone is evident on unenhanced, wide‐windowed
images (a–c: arrows). A focal hyperattenuating epidural hemorrhage is evident on the same unenhanced images (narrow window)
adjacent to the internal surface of the largest fracture fragment (d: arrow). A smaller hyperattenuating lesion is present within the right
frontal lobe, consistent with acute intraparenchymal hemorrhage (d: arrowhead). Regional hypoattenuation in the right frontal lobe is
consistent with parenchymal edema (e: arrows). Decompressive craniotomy confirmed the epidural hematoma.
175