
Page 199 - Veterinary Toxicology, Basic and Clinical Principles, 3rd Edition
P. 199
166 SECTION | I General
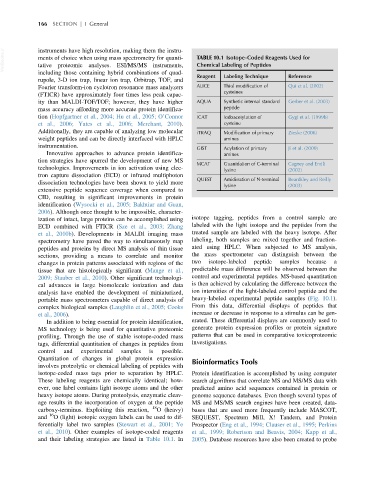
VetBooks.ir instruments have high resolution, making them the instru- TABLE 10.1 Isotope-Coded Reagents Used for
ments of choice when using mass spectrometry for quanti-
Chemical Labeling of Peptides
tative proteomic analyses. ESI/MS/MS instruments,
including those containing hybrid combinations of quad-
Reagent Labeling Technique Reference
rupole, 3-D ion trap, linear ion trap, Orbitrap, TOF, and
Fourier transform-ion cyclotron resonance mass analyzers ALICE Thiol modification of Qui et al. (2002)
cysteines
(FTICR) have approximately four times less peak capac-
ity than MALDI-TOF/TOF; however, they have higher AQUA Synthetic internal standard Gerber et al. (2003)
mass accuracy affording more accurate protein identifica- peptide
tion (Hopfgartner et al., 2004; Hu et al., 2005; O’Connor ICAT Iodoacetylation of Gygi et al. (1999b)
et al., 2006; Yates et al., 2006; Merchant, 2010). cysteine
Additionally, they are capable of analyzing low molecular iTRAQ Modification of primary Zieske (2006)
weight peptides and can be directly interfaced with HPLC amines
instrumentation. GIST Acylation of primary Ji et al. (2000)
Innovative approaches to advance protein identifica- amines
tion strategies have spurred the development of new MS
MCAT Guanidation of C-terminal Cagney and Emili
technologies. Improvements in ion activation using elec- lysine (2002)
tron capture dissociation (ECD) or infrared multiphoton
QUEST Amidination of N-terminal Beardsley and Reilly
dissociation technologies have been shown to yield more
lysine (2003)
extensive peptide sequence coverage when compared to
CID, resulting in significant improvements in protein
identification (Wysocki et al., 2005; Bakhtiar and Guan,
2006). Although once thought to be impossible, character-
ization of intact, large proteins can be accomplished using isotope tagging, peptides from a control sample are
ECD combined with FTICR (Sze et al., 2003; Zhang labeled with the light isotope and the peptides from the
et al., 2010b). Developments in MALDI imaging mass treated sample are labeled with the heavy isotope. After
spectrometry have paved the way to simultaneously map labeling, both samples are mixed together and fraction-
peptides and proteins by direct MS analysis of thin tissue ated using HPLC. When subjected to MS analysis,
sections, providing a means to correlate and monitor the mass spectrometer can distinguish between the
changes in protein patterns associated with regions of the two isotope-labeled peptide samples because a
tissue that are histologically significant (Mange et al., predictable mass difference will be observed between the
2009; Stauber et al., 2010). Other significant technologi- control and experimental peptides. MS-based quantitation
cal advances in large biomolecule ionization and data is then achieved by calculating the difference between the
analysis have enabled the development of miniaturized, ion intensities of the light-labeled control peptide and the
portable mass spectrometers capable of direct analysis of heavy-labeled experimental peptide samples (Fig. 10.1).
complex biological samples (Laughlin et al., 2005; Cooks From this data, differential displays of peptides that
et al., 2006). increase or decrease in response to a stimulus can be gen-
In addition to being essential for protein identification, erated. These differential displays are commonly used to
MS technology is being used for quantitative proteomic generate protein expression profiles or protein signature
profiling. Through the use of stable isotope-coded mass patterns that can be used in comparative toxicoproteomic
tags, differential quantitation of changes in peptides from investigations.
control and experimental samples is possible.
Quantitation of changes in global protein expression Bioinformatics Tools
involves proteolytic or chemical labeling of peptides with
isotope-coded mass tags prior to separation by HPLC. Protein identification is accomplished by using computer
These labeling reagents are chemically identical; how- search algorithms that correlate MS and MS/MS data with
ever, one label contains light isotope atoms and the other predicted amino acid sequences contained in protein or
heavy isotope atoms. During proteolysis, enzymatic cleav- genome sequence databases. Even though several types of
age results in the incorporation of oxygen at the peptide MS and MS/MS search engines have been created, data-
18
carboxy-terminus. Exploiting this reaction, O (heavy) bases that are used more frequently include MASCOT,
16
and O (light) isotopic oxygen labels can be used to dif- SEQUEST, Spectrum Mill, X! Tandem, and Protein
ferentially label two samples (Stewart et al., 2001; Ye Prospector (Eng et al., 1994; Clauser et al., 1995; Perkins
et al., 2010). Other examples of isotope-coded reagents et al., 1999; Robertson and Beavis, 2004; Kapp et al.,
and their labeling strategies are listed in Table 10.1.In 2005). Database resources have also been created to probe