
Page 250 - Linear Models for the Prediction of Animal Breeding Values 3rd Edition
P. 250
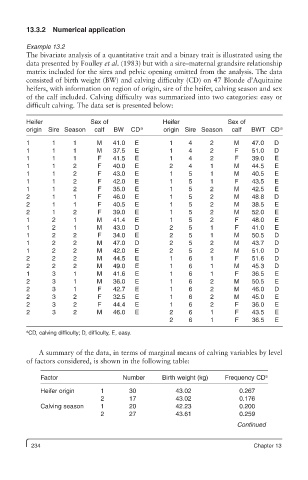
13.3.2  Numerical application

         Example 13.2
         The bivariate analysis of a quantitative trait and a binary trait is illustrated using the
         data presented by Foulley et al. (1983) but with a sire–maternal grandsire relationship
         matrix included for the sires and pelvic opening omitted from the analysis. The data
         consisted of birth weight (BW) and calving difficulty (CD) on 47 Blonde d’Aquitaine
         heifers, with information on region of origin, sire of the heifer, calving season and sex
         of the calf included. Calving difficulty was summarized into two categories: easy or
         difficult calving. The data set is presented below:
         Heifer            Sex of               Heifer            Sex of
         origin  Sire Season  calf  BW  CD a    origin Sire Season  calf  BWT CD a
         1      1     1      M   41.0   E        1     4     2      M    47.0  D
         1      1     1      M   37.5   E        1     4     2      F    51.0  D
         1      1     1      F   41.5   E        1     4     2      F    39.0  E
         1      1     2      F   40.0   E        2     4     1      M    44.5  E
         1      1     2      F   43.0   E        1     5     1      M    40.5  E
         1      1     2      F   42.0   E        1     5     1      F    43.5  E
         1      1     2      F   35.0   E        1     5     2      M    42.5  E
         2      1     1      F   46.0   E        1     5     2      M    48.8  D
         2      1     1      F   40.5   E        1     5     2      M    38.5  E
         2      1     2      F   39.0   E        1     5     2      M    52.0  E
         1      2     1      M   41.4   E        1     5     2      F    48.0  E
         1      2     1      M   43.0  D         2     5     1      F    41.0  E
         1      2     2      F   34.0   E        2     5     1      M    50.5  D
         1      2     2      M   47.0  D         2     5     2      M    43.7  D
         1      2     2      M   42.0   E        2     5     2      M    51.0  D
         2      2     2      M   44.5   E        1     6     1      F    51.6  D
         2      2     2      M   49.0   E        1     6     1      M    45.3  D
         1      3     1      M   41.6   E        1     6     1      F    36.5  E
         2      3     1      M   36.0   E        1     6     2      M    50.5  E
         2      3     1      F   42.7   E        1     6     2      M    46.0  D
         2      3     2      F   32.5   E        1     6     2      M    45.0  E
         2      3     2      F   44.4   E        1     6     2      F    36.0  E
         2      3     2      M   46.0   E        2     6     1      F    43.5  E
                                                 2     6     1      F    36.5  E
         a CD, calving difficulty; D, difficulty, E, easy.


            A summary of the data, in terms of marginal means of calving variables by level
         of factors considered, is shown in the following table:

             Factor                 Number     Birth weight (kg)  Frequency CD a
             Heifer origin    1       30           43.02             0.267
                              2       17           43.02             0.176
             Calving season   1       20           42.23             0.200
                              2       27           43.61             0.259
                                                                     Continued


          234                                                            Chapter 13