
Page 245 - Linear Models for the Prediction of Animal Breeding Values 3rd Edition
P. 245
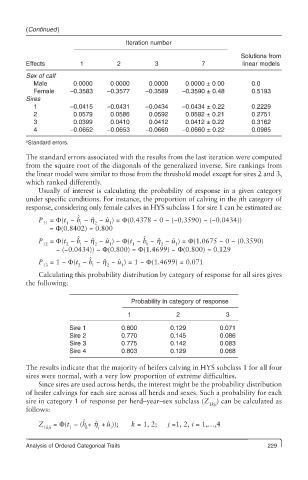
(Continued)
                                     Iteration number

                                                                      Solutions from
        Effects         1         2          3             7          linear models
        Sex of calf
           Male       0.0000     0.0000     0.0000    0.0000 ± 0.00      0.0
           Female    −0.3583    −0.3577   −0.3589    −0.3590 ± 0.48      0.5193
        Sires
           1         −0.0415    −0.0431   −0.0434    −0.0434 ± 0.22      0.2229
           2          0.0579     0.0586     0.0592    0.0592 ± 0.21      0.2751
           3          0.0399     0.0410     0.0412    0.0412 ± 0.22      0.3162
           4         −0.0652    −0.0653   −0.0660    −0.0660 ± 0.22      0.0985
        a Standard errors.

        The standard errors associated with the results from the last iteration were computed
        from the square root of the diagonals of the generalized inverse. Sire rankings from
        the linear model were similar to those from the threshold model except for sires 2 and 3,
        which ranked differently.
            Usually of interest is calculating the probability of response in a given category
        under specific conditions. For instance, the proportion of calving in the jth category of
        response, considering only female calves in HYS subclass 1 for sire 1 can be estimated as:
                       ˆ
            P  = F(t  − h  − h ˆ  − uˆ ) = F(0.4378 − 0 − (−0.3590) − (−0.0434))
             11     1   1   2   1
               = F(0.8402) = 0.800
                                          ˆ
                       ˆ
                                                  ˆ
                               ˆ
            P  = F(t  − h  − h ˆ  − u ) − F(t  − h  − h ˆ  − u ) = F(1.0675 − 0 − (0.3590)
             12     2   1   2   1      1   1   2   1
                 − (−0.0434)) − F(0.800) = F(1.4699) − F(0.800) = 0.129
                           ˆ
            P  = 1 − F(t  − h  − h ˆ  − uˆ ) = 1 − F(1.4699) = 0.071
             13        2   1   2    1
            Calculating this probability distribution by category of response for all sires gives
        the following:
                                      Probability in category of response
                                     1             2             3
                     Sire 1         0.800         0.129         0.071
                     Sire 2         0.770         0.145         0.086
                     Sire 3         0.775         0.142         0.083
                     Sire 4         0.803         0.129         0.068

        The results indicate that the majority of heifers calving in HYS subclass 1 for all four
        sires were normal, with a very low proportion of extreme difficulties.
            Since sires are used across herds, the interest might be the probability distribution
        of heifer calvings for each sire across all herds and sexes. Such a probability for each
        sire in category 1 of response per herd–year–sex subclass (Z  ) can be calculated as
                                                             1kji
        follows:
                         ˆ
            Z    = F(t  − (h + h ˆ  + ˆu ));  k = 1, 2;  j =1, 2, i = 1,…,4
             1kji    1   k   j   i
        Analysis of Ordered Categorical Traits                               229