
Page 79 - Linear Models for the Prediction of Animal Breeding Values 3rd Edition
P. 79
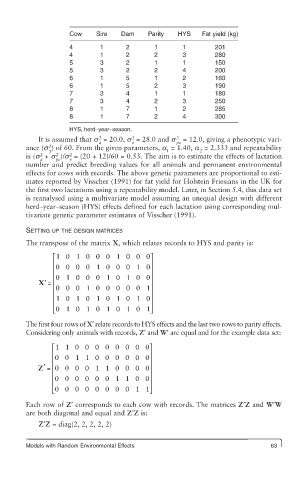
Cow    Sire    Dam    Parity   HYS    Fat yield (kg)
                     4        1      2       1       1        201
                     4        1      2       2       3        280
                     5        3      2       1       1        150
                     5        3      2       2       4        200
                     6        1      5       1       2        160
                     6        1      5       2       3        190
                     7        3      4       1       1        180
                     7        3      4       2       3        250
                     8        1      7       1       2        285
                     8        1      7       2       4        300
                     HYS, herd–year–season.
                                       2
                                                   2
                             2
            It is assumed that s  = 20.0, s  = 28.0 and s  = 12.0, giving a phenotypic vari-
                                       e
                             a
                                                   pe
               2
        ance (s ) of 60. From the given parameters, a  = 1.40, a  = 2.333 and repeatability
               y
                                                 1
                                                          2
                 2
                     2
             2
        is (s  + s )/s  = (20 + 12)/60 = 0.53. The aim is to estimate the effects of lactation
             a   pe  y
        number and predict breeding values for all animals and permanent environmental
        effects for cows with records. The above genetic parameters are proportional to esti-
        mates reported by Visscher (1991) for fat yield for Holstein Friesians in the UK for
        the first two lactations using a repeatability model. Later, in Section 5.4, this data set
        is reanalysed using a multivariate model assuming an unequal design with different
        herd–year–season (HYS) effects defined for each lactation using corresponding mul-
        tivariate genetic parameter estimates of Visscher (1991).
        SETTING UP THE DESIGN MATRICES
        The transpose of the matrix X, which relates records to HYS and parity is:
                ⎡ 1 0 1 000 1 000⎤
                ⎢                           ⎥
                ⎢ 000 0     1 000 1 0       ⎥
                ⎢ 0 1 0 0 0 10 10 0⎥
            X ′ = ⎢                         ⎥
                ⎢ 000 1 00000 1             ⎥
                ⎢ 10 10 10 10 10            ⎥
                ⎢                           ⎥
                ⎣ ⎢ 01 0 110 10 10 1⎥       ⎦
        The first four rows of X′ relate records to HYS effects and the last two rows to parity effects.
        Considering only animals with records, Z′ and W′ are equal and for the example data set:
                ⎡ 11 00000000⎤
                ⎢                           ⎥
                ⎢ 00 11 000000              ⎥
                ⎢ ⎢
            Z ′ = 0000 11 0000⎥
                ⎢                           ⎥
                ⎢ 000000 11 00              ⎥
                ⎢ ⎣ 00000000 11             ⎥ ⎦

        Each row of Z′ corresponds to each cow with records. The matrices Z′Z and W′W
        are both diagonal and equal and Z′Z is:
            Z′Z = diag(2, 2, 2, 2, 2)


        Models with Random Environmental Effects                              63