
Page 40 - Feline diagnostic imaging
P. 40
3.8 Artifacts 33
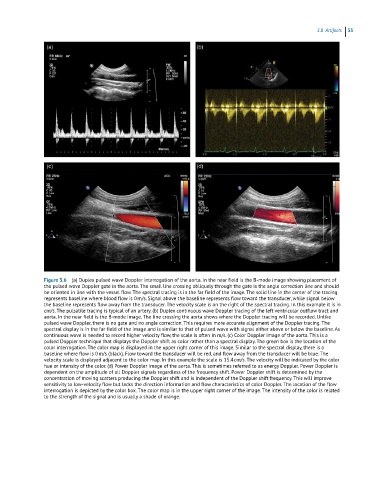
Figure 3.6 (a) Duplex pulsed wave Doppler interrogation of the aorta. In the near field is the B-mode image showing placement of
the pulsed wave Doppler gate in the aorta. The small line crossing obliquely through the gate is the angle correction line and should
be oriented in line with the vessel flow. The spectral tracing is in the far field of the image. The solid line in the center of the tracing
represents baseline where blood flow is 0 m/s. Signal above the baseline represents flow toward the transducer, while signal below
the baseline represents flow away from the transducer. The velocity scale is on the right of the spectral tracing. In this example it is in
cm/s. The pulsatile tracing is typical of an artery. (b) Duplex continuous wave Doppler tracing of the left ventricular outflow tract and
aorta. In the near field is the B-mode image. The line crossing the aorta shows where the Doppler tracing will be recorded. Unlike
pulsed wave Doppler, there is no gate and no angle correction. This requires more accurate alignment of the Doppler tracing. The
spectral display is in the far field of the image and is similar to that of pulsed wave with signal either above or below the baseline. As
continuous wave is needed to record higher velocity flow, the scale is often in m/s. (c) Color Doppler image of the aorta. This is a
pulsed Doppler technique that displays the Doppler shift as color rather than a spectral display. The green box is the location of the
color interrogation. The color map is displayed in the upper right corner of this image. Similar to the spectral display, there is a
baseline where flow is 0 m/s (black). Flow toward the transducer will be red, and flow away from the transducer will be blue. The
velocity scale is displayed adjacent to the color map. In this example the scale is 15.4 cm/s. The velocity will be indicated by the color
hue or intensity of the color. (d) Power Doppler image of the aorta. This is sometimes referred to as energy Doppler. Power Doppler is
dependent on the amplitude of all Doppler signals regardless of the frequency shift. Power Doppler shift is determined by the
concentration of moving scatters producing the Doppler shift and is independent of the Doppler shift frequency. This will improve
sensitivity to low-velocity flow but lacks the direction information and flow characteristics of color Doppler. The location of the flow
interrogation is depicted by the color box. The color map is in the upper right corner of the image. The intensity of the color is related
to the strength of the signal and is usually a shade of orange.