
Page 436 - Feline diagnostic imaging
P. 436
26.3 Ultrasonography 447
(a) (b)
(c) (d)
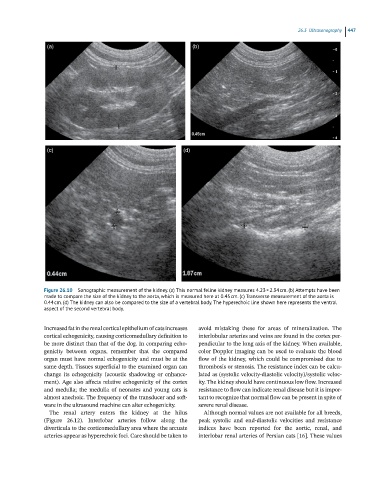
Figure 26.10 Sonographic measurement of the kidney. (a) This normal feline kidney measures 4.23 × 2.34 cm. (b) Attempts have been
made to compare the size of the kidney to the aorta, which is measured here at 0.45 cm. (c) Transverse measurement of the aorta is
0.44 cm. (d) The kidney can also be compared to the size of a vertebral body. The hyperechoic line shown here represents the ventral
aspect of the second vertebral body.
Increased fat in the renal cortical epithelium of cats increases avoid mistaking these for areas of mineralization. The
cortical echogenicity, causing corticomedullary definition to interlobular arteries and veins are found in the cortex per-
be more distinct than that of the dog. In comparing echo- pendicular to the long axis of the kidney. When available,
genicity between organs, remember that the compared color Doppler imaging can be used to evaluate the blood
organ must have normal echogenicity and must be at the flow of the kidney, which could be compromised due to
same depth. Tissues superficial to the examined organ can thrombosis or stenosis. The resistance index can be calcu-
change its echogenicity (acoustic shadowing or enhance- lated as (systolic velocity‐diastolic velocity)/systolic veloc-
ment). Age also affects relative echogenicity of the cortex ity. The kidney should have continuous low flow. Increased
and medulla; the medulla of neonates and young cats is resistance to flow can indicate renal disease but it is impor-
almost anechoic. The frequency of the transducer and soft- tant to recognize that normal flow can be present in spite of
ware in the ultrasound machine can alter echogenicity. severe renal disease.
The renal artery enters the kidney at the hilus Although normal values are not available for all breeds,
(Figure 26.12). Interlobar arteries follow along the peak systolic and end‐diastolic velocities and resistance
diverticula to the corticomedullary area where the arcuate indices have been reported for the aortic, renal, and
arteries appear as hyperechoic foci. Care should be taken to interlobar renal arteries of Persian cats [16]. These values