Page 29 - DPR Rishikesh Legacy_Neat
P. 29

Date of Sampling

                  S                                    SWM Rules, 2016          Sample Description &
                  .                                  Standards for treated             Result
                          Parameter          Unit          leachate
                  N                                   Mode of Disposal:
                  o                                   Public Sewer (max)         LS 1          LS 2
                  .
                  1 Mercury (as Hg)          mg/l              0.01                0.84           0.96
                  1
                  1 Lead (as Pb)             mg/l              1.0                 0.98           0.74
                  2
                  1
                   Cadmium (as Cd)
                  3                          mg/l              1.0                  -              -
                  1Total  Chromium  (as      mg/l              2.0                 9.78           1.21
                  4 Cr)
                  1 Copper (as Cu)           mg/l              3.0                 0.48           1.01
                  5
                  1 Nickel (as Ni)           mg/l              3.0                 0.41           0.54
                  6
                  1
                   Zinc (as Zn)
                  7                          mg/l              15.0           18.29         4.78
                  1Phenolic  compounds       µg/l              5.0            0.34          0.17
                  8 as C6H5OH)
                   (
                  1Ammoniacal
                  9 Nitrogen (as N)          mg/l               50            45.54         126.91


               3.6 BASELINE ENVIRONMENTAL MONITORING

                      The  baseline  environmental  monitoring  consists  of  Air,  Noise  and  Ground  water
                      monitoring.  These  environmental  baseline  data  can  represent  the  existing  fate  to
                      environment  and can  be  compared  with  post-biomining monitoring  data  to  evaluate
                      the positive effects of project on environment.

                      a. For baseline ambient air, noise & ground water quality monitoring 2 no. of samples
                      each were collected.

                      b. For ambient air monitoring and noise monitoring one sample was taken at site and
                      another sample was taken at the downwind direction of the wind rose within a radial
                      distance of 2.0 km from the dumping ground for one week.

                      c. Noise levels were measured for 24 hours continuous monitoring in dB(A) Leq.

                      d. The parameters covered under the baseline ambient air & ground water quality
                      monitoring is as represented in Table 3-11 and 3-14 respectively.

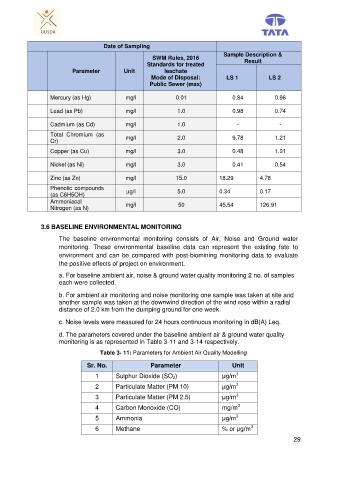
                                    Table 3- 11: Parameters for Ambient Air Quality Modelling
                                Sr. No.               Parameter                    Unit

                                                                                    3
                                   1      Sulphur Dioxide (SO 2)               μg/m
                                                                                    3
                                   2      Particulate Matter (PM 10)           μg/m
                                                                                    3
                                   3      Particulate Matter (PM 2.5)          μg/m
                                                                                     3
                                   4      Carbon Monoxide (CO)                 mg/m
                                                                                    3
                                   5      Ammonia                              μg/m
                                                                                         3
                                   6      Methane                              % or μg/m
                                                                                                        29
   24   25   26   27   28   29   30   31   32   33   34