


Page 105 - MAT KS3 Y8 Cambridge CheckPoint
P. 105
10.1 Calculating statistics from discrete data


               10.1 Calculating statistics from discrete data


               In statistics, the mode, the median and the mean are averages.
                                                                                  An average is a single value that
               The range is a measure of how spread out the numbers are. It is not   summarises the whole set of
               an average.                                                        numbers.
               Use what you know to check the results for this set of 10 masses.


                 12 kg  14 kg  14 kg  14 kg  14 kg             Mode = most common value
                 15 kg  17 kg  17 kg  20 kg  22 kg             Median = middle value, when the values are put in order

                                                               Mean = sum of all values ÷ total number of values
               Mode = 14 kg       Median = 14.5 kg
               Mean = 15.9 kg     Range = 10 kg                Range = largest value − smallest value
               When you have a large set of numbers they will be given in a frequency table. You need to be able to
               work out averages and range from a frequency table.


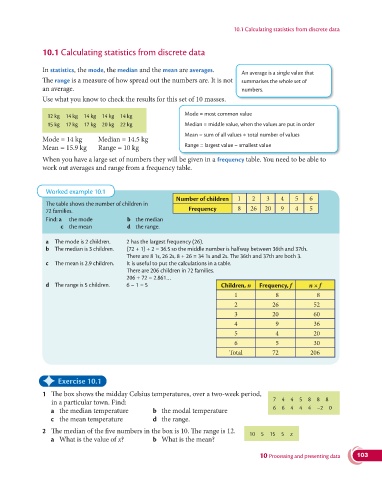
                Worked example 10.1
                                                            Number of children  1    2    3    4    5   6
                The table shows the number of children in
                72 families.                                    Frequency       8    26  20    9    4   5
                Find: a the mode           b the median
                     c the mean            d the range.

                a  The mode is 2 children.   2 has the largest frequency (26).
                b  The median is 3 children.   (72 + 1) ÷ 2 = 36.5 so the middle number is halfway between 36th and 37th.
                                           There are 8 1s, 26 2s, 8 + 26 = 34 1s and 2s. The 36th and 37th are both 3.
                c  The mean is 2.9 children.   It is useful to put the calculations in a table.
                                           There are 206 children in 72 families.
                                           206 ÷ 72 = 2.861…
                d  The range is 5 children.   6 − 1 = 5                    Children, n  Frequency, f    n × f
                                                                               1             8             8
                                                                               2            26            52
                                                                               3            20            60
                                                                               4             9            36
                                                                               5             4            20
                                                                               6             5            30
                                                                              Total         72           206


               ✦     Exercise 10.1

               1   The box shows the midday Celsius temperatures, over a two-week period,
                                                                                            7 4 4 5 8 8 8
                  in a particular town. Find:
                                                                                            6 6 4 4 4 −2 0
                  a  the median temperature         b  the modal temperature
                  c  the mean temperature           d the range.
               2  The median of the five numbers in the box is 10. The range is 12.
                                                                                    10 5 15 5  x
                  a  What is the value of x?        b  What is the mean?

                                                                                        10 Processing and presenting data  103

