


Page 107 - MAT KS3 Y8 Cambridge CheckPoint
P. 107
10.2 Calculating statistics from grouped or continuous data


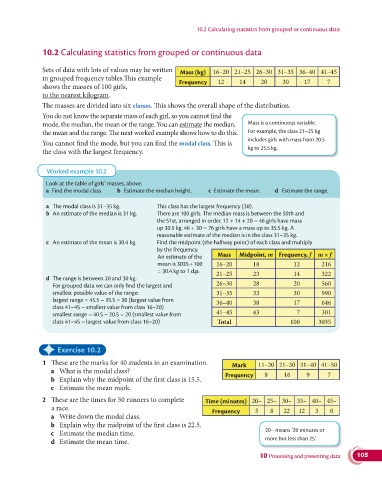
               10.2 Calculating statistics from grouped or continuous data


               Sets of data with lots of values may be written   Mass (kg)  16–20 21–25 26–30 31–35 36–40 41–45
               in grouped frequency tables.This example
                                                             Frequency    12     14     20     30      17     7
               shows the masses of 100 girls,
               to the nearest kilogram.
               The masses are divided into six classes. This shows the overall shape of the distribution.

               You do not know the separate mass of each girl, so you cannot find the
               mode, the median, the mean or the range. You can estimate the median,   Mass is a continuous variable.
               the mean and the range. The next worked example shows how to do this.  For example, the class 21–25 kg
                                                                                    includes girls with mass from 20.5
               You cannot find the mode, but you can find the modal class. This is
                                                                                    kg to 25.5 kg.
               the class with the largest frequency.


                 Worked example 10.2

                Look at the table of girls’ masses, above.
                a  Find the modal class.   b  Estimate the median height.   c  Estimate the mean.   d  Estimate the range.

                a  The modal class is 31–35 kg.      This class has the largest frequency (30).
                b  An estimate of the median is 31 kg.     There are 100 girls. The median mass is between the 50th and
                                                     the 51st, arranged in order. 12 + 14 + 20 = 46 girls have mass
                                                     up 30.5 kg. 46 + 30 = 76 girls have a mass up to 35.5 kg. A
                                                     reasonable estimate of the median is in the class 31–35 kg.
                c  An estimate of the mean is 30.4 kg.     Find the midpoint (the halfway point) of each class and multiply
                                                     by the frequency.
                                                        An estimate of the   Mass  Midpoint, m Frequency, fm × f
                                                      mean is 3035 ÷ 100    16–20    18            12       216
                                                      = 30.4 kg to 1 d.p.  21–25     23            14       322
                d  The range is between 20 and 30 kg.
                     For grouped data we can only find the largest and    26–30       28            20       560
                   smallest possible value of the range:                 31–35       33            30       990
                     largest range = 45.5 – 15.5 = 30 (largest value from    36–40   38            17       646
                   class 41–45 – smallest value from class 16–20)
                     smallest range = 40.5 – 20.5 = 20 (smallest value from    41–45  43            7       301
                   class 41–45 – largest value from class 16–20)          Total                   100      3035


               ✦     Exercise 10.2


               1  These are the marks for 40 students in an examination.
                                                                              Mark     11–20 21–30 31–40 41–50
                  a  What is the modal class?
                                                                            Frequency    8      16     9      7
                  b  Explain why the midpoint of the first class is 15.5.
                  c  Estimate the mean mark.

               2   These are the times for 50 runners to complete    Time (minutes) 20– 25– 30– 35– 40– 45–
                  a race.
                                                                        Frequency     5    8    22   12   3    0
                  a  Write down the modal class.
                  b  Explain why the midpoint of the first class is 22.5.
                                                                                          20– means ‘20 minutes or
                  c  Estimate the median time.
                                                                                          more but less than 25’.
                  d  Estimate the mean time.
                                                                                        10 Processing and presenting data  105

