


Page 109 - MAT KS3 Y8 Cambridge CheckPoint
P. 109
10.3 Using statistics to compare two distributions


               10.3 Using statistics to compare two distributions


               Suppose you have two sets of test marks, or the heights of two
                                                                                 The average that is most appropriate will
               groups of people. How can you compare the two sets?
                                                                                 depend on the actual data.
               One way is to find one or more of the averages, and the range.
               The range will show which of the two sets of data is more spread out.

                 Worked example 10.3

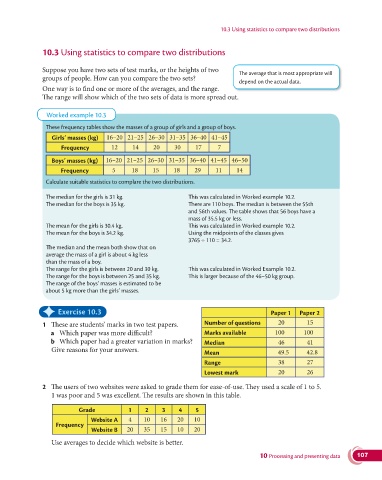
                These frequency tables show the masses of a group of girls and a group of boys.
                  Girls’ masses (kg)  16–20 21–25 26–30 31–35 36–40 41–45
                     Frequency        12     14     20     30     17      7

                  Boys’ masses (kg)  16–20 21–25 26–30 31–35 36–40 41–45 46–50
                     Frequency         5     18     15     18     29     11     14
                Calculate suitable statistics to complare the two distributions.

                The median for the girls is 31 kg.              This was calculated in Worked example 10.2.
                The median for the boys is 35 kg.                 There are 110 boys. The median is between the 55th
                                                                and 56th values. The table shows that 56 boys have a
                                                                mass of 35.5 kg or less.
                The mean for the girls is 30.4 kg.              This was calculated in Worked example 10.2.
                The mean for the boys is 34.2 kg.                 Using the midpoints of the classes gives
                                                                3765 ÷ 110 = 34.2.
                The median and the mean both show that on
                average the mass of a girl is about 4 kg less
                than the mass of a boy.
                The range for the girls is between 20 and 30 kg.      This was calculated in Worked Example 10.2.
                The range for the boys is between 25 and 35 kg.     This is larger because of the 46–50 kg group.
                The range of the boys’ masses is estimated to be
                about 5 kg more than the girls’ masses.

               ✦     Exercise 10.3                                                         Paper 1   Paper 2


               1  These are students’ marks in two test papers.      Number of questions      20       15
                  a  Which paper was more difficult?                 Marks available         100      100
                  b  Which paper had a greater variation in marks?   Median                   46       41
                  Give reasons for your answers.
                                                                     Mean                     49.5     42.8
                                                                     Range                    38       27
                                                                     Lowest mark              20       26

               2   The users of two websites were asked to grade them for ease-of-use. They used a scale of 1 to 5.
                  1 was poor and 5 was excellent. The results are shown in this table.

                           Grade            1     2    3     4    5
                               Website A    4    10    16   20    10
                    Frequency
                               Website B   20    35    15   10    20

                  Use averages to decide which website is better.
                                                                                        10 Processing and presenting data  107

