


Page 110 - MAT KS3 Y8 Cambridge CheckPoint
P. 110
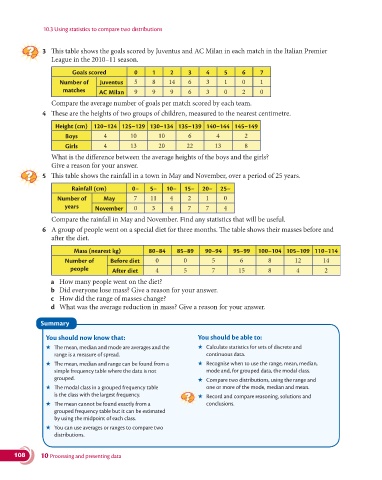
10.3 Using statistics to compare two distributions


               3   This table shows the goals scored by Juventus and AC Milan in each match in the Italian Premier
                  League in the 2010–11 season.
                         Goals  scored        0     1     2     3     4     5     6     7

                     Number of    Juventus    5     8    14     6     3     1     0     1
                      matches     AC Milan    9     9     9     6     3     0     2     0

                  Compare the average number of goals per match scored by each team.
               4  These are the heights of two groups of children, measured to the nearest centimetre.

                   Height (cm) 120–124 125–129 130–134 135–139 140–144 145–149
                       Boys         4        10       10        6        4         2
                       Girls        4        13       20       22        13        8
                  What is the difference between the average heights of the boys and the girls?
                  Give a reason for your answer.
               5  This table shows the rainfall in a town in May and November, over a period of 25 years.

                         Rainfall (cm)       0–    5–    10–   15–   20–   25–
                    Number of       May       7    11     4     2     1     0
                       years     November     0     3     4     7     7     4

                  Compare the rainfall in May and November. Find any statistics that will be useful.
               6   A group of people went on a special diet for three months. The table shows their masses before and
                  after the diet.

                          Mass (nearest kg)        80–84    85–89    90–94     95–99   100–104 105–109 110–114
                       Number of      Before diet    0        0         5        6         8       12        14
                        people        After diet     4        5         7        15        8        4        2

                  a  How many people went on the diet?
                  b  Did everyone lose mass? Give a reason for your answer.
                  c  How did the range of masses change?
                  d  What was the average reduction in mass? Give a reason for your answer.


               Summary

                You should now know that:                          You should be able to:
                ★   The mean, median and mode are averages and the   ★   Calculate statistics for sets of discrete and
                   range is a measure of spread.                      continuous data.
                ★   The mean, median and range can be found from a   ★   Recognise when to use the range, mean, median,
                   simple frequency table where the data is not       mode and, for grouped data, the modal class.
                   grouped.                                        ★   Compare two distributions, using the range and
                ★   The modal class in a grouped frequency table      one or more of the mode, median and mean.
                   is the class with the largest frequency.        ★   Record and compare reasoning, solutions and
                ★   The mean cannot be found exactly from a           conclusions.
                   grouped frequency table but it can be estimated
                   by using the midpoint of each class.
                ★   You can use averages or ranges to compare two
                   distributions.


      108      10 Processing and presenting data

