


Page 106 - MAT KS3 Y8 Cambridge CheckPoint
P. 106
10.1 Calculating statistics from discrete data


               3  Hassan recorded the number of people in 60 passing cars.
                  Here are his results. Find:
                  a  the missing frequency                         People      1     2     3     4     5     6
                  b  the modal number of people in a car          Frequency    28          3     7     1     1
                  c  the median    d the mean.

               4  Oditi throws two dice and adds the scores.
                  She does this 36 times. Here are the results.
                  Find:
                  a  the mode      b the median              Score     2   3   4   5   6   7   8   9  10 11 12
                  c  the mean      d the range.            Frequency   3   0   2   4   5   4   6   8   1   1   2

               5  A quiz has 10 questions. 120 students take the quiz.
                  The table shows their scores.

                     Questions answered correctly   4     5     6     7     8     9    10
                             Frequency              3     5    12    13    17    30    40

                  How many students scored:
                  a  more than the median           b  more than the mode           c  more than the mean?

               6  This table shows the results of 60 throws of a biased dice. Read what Ahmad, Harsha and Alicia say.

                     Score      1   2    3    4    5    6
                   Frequency   11   9    10   8   19    3


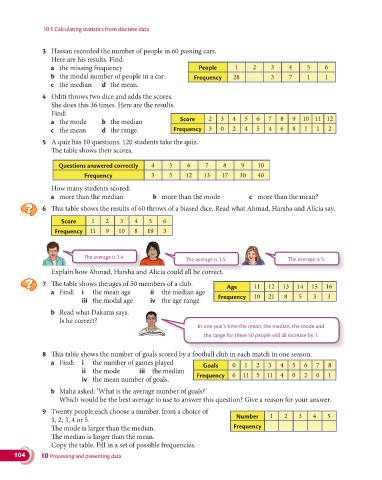
                             The average is 3.4.
                                                               The average is 3.5.               The average is 5.
                  Explain how Ahmad, Harsha and Alicia could all be correct.
                                                       a could all be correct
               7  The table shows the ages of 50 members of a club.
                                                                             Age      11   12  13   14   15   16
                  a  Find:  i   the mean age       ii  the median age
                            iii  the modal age     iv  the age range      Frequency   10   21   8    5   3    3
                  b  Read what Dakarai says.
                     Is he correct?
                                                                   In one year’s time the mean, the median, the mode and
                                                                     the range for these 50 people will all increase by 1.


               8  This table shows the number of goals scored by a football club in each match in one season.
                  a  Find:  i   the number of games played
                                                                     Goals     0   1   2   3   4   5   6   7   8
                            ii the mode         iii the median
                                                                   Frequency   6  11   5  11   4   0   2   0   1
                            iv  the mean number of goals.
                  b  Maha asked: ‘What is the average number of goals?’
                       Which would be the best average to use to answer this question? Give a reason for your answer.

               9  Twenty people each choose a number, from a choice of
                  1, 2, 3, 4 or 5.                                              Number     1    2    3   4    5
                  The mode is larger than the median.                          Frequency
                  The median is larger than the mean.
                  Copy the table. Fill in a set of possible frequencies.
      104      10 Processing and presenting data

