


Page 108 - MAT KS3 Y8 Cambridge CheckPoint
P. 108
10.2 Calculating statistics from grouped or continuous data


               3  This table shows the heights of 60 young children.

                   Height (cm)   80–84    85–89    90–94    95–99   100–104 105–109
                    Frequency     10       20       15       10        3         2

                  a  Estimate the median height.
                  b  What is the largest possible value of the range?
                  c  Estimate the mean height.
               4  This table shows the lengths of 50 text messages sent from a mobile phone.

                    Number of characters   1–10 11–20 21–30 31–40 41–50 51–60
                         Frequency          10      8     12     16      3      1

                  a  Write down the modal class.
                  b  Explain why the median must be more than 20.
                  c  Explain why the range must be more than 40.
                  d  Estimate the mean length of a text message.

               5  A survey of the time people spent travelling     Journey time                         Frequency
                  to work one morning gave these results.       Up to 30 minutes                           15
                  a  How many people were involved in the
                                                                30 minutes or more but less than one hour  30
                     survey?
                                                                                             1
                  b  Write down the modal class.                One hour of more but less than  1  hours   10
                                                                                             2
                  c  Estimate the median journey time.
                                                                 1
                                                                1  hours or more but less than two hours
                  d  Estimate the mean journey time.             2                                          2

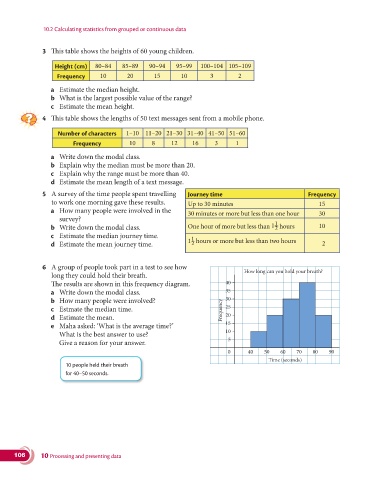
               6  A group of people took part in a test to see how
                                                                                   How long can you hold your breath?
                  long they could hold their breath.
                  The results are shown in this frequency diagram.          40
                  a  Write down the modal class.                            35
                  b  How many people were involved?                         30
                  c  Estmate the median time.                              Frequency  25
                  d  Estimate the mean.                                     20
                  e  Maha asked: ‘What is the average time?’                15
                                                                            10
                       What is the best answer to use?
                                                                             5
                       Give a reason for your answer.
                                                                             0      40   50    60   70   80    90
                                                                                           Time (seconds)
                       10 people held their breath
                       for 40–50 seconds.


      106      10 Processing and presenting data

