
Page 27 - CJO_F17_GLAUCOMA_SUPPLEMENT
P. 27
MANAGING OPEN ANGLE GLAUCOMA
loss is identified. 213,214 Please note the deliberate use of the words ‘ancillary’ and ‘complement’: OCT, like automated
visual field analysis, is a tool to inform our clinical judgement and decision-making, not replace it. That being said,
it is an extremely useful tool, providing accurate (4 to 5μm axial resolution) and reproducible (≤3% inter-scan vari-
ability) quantification of ONH, RNFL, and retinal ganglion cell (RGC) parameters. 49,215,216
Clinical Recommendation for ancillary imaging in glaucoma:
• OCT augments but definitely does not replace clinical examination. Although objective imaging has
become an invaluable ancillary test, ‘… a thorough clinical examination combined with a healthy dose of
common sense is superior to imaging technology …’ (Chong GT, Lee RK; 2012).
Just as an AVF analysis must be reliable, an OCT scan must be of high quality. Adequate signal strength is essential,
as weak scans can dramatically underestimate RNFL thickness. Motion or blink artifacts, improper alignment, or
217
incorrect segmentation algorithms can result in unreliable data: it is critical that each scan be qualitatively assessed
to ensure accuracy and quality. 218,219 Some examples of common OCT artifacts are shown in Figure 9.
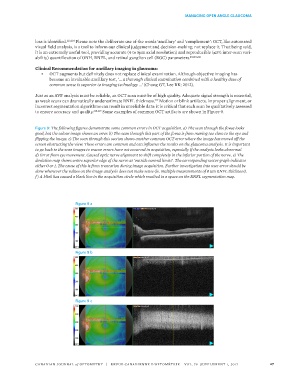
Figure 9: The following figures demonstrate some common errors in OCT acquisition. a) The scan through the fovea looks
good, but the colour image shows an error. b) The scan through this part of the fovea is from moving too close to the eye and
flipping the image. c) The scan through this section shows another common OCT error where the image has moved off the
screen obstructing the view. These errors are common and can influence the results on the glaucoma analysis. It is important
to go back to the scan images to ensure errors have not occurred in acquisition, especially if the analysis looks abnormal.
d) Error from eye movement. Caused optic nerve alignment to shift completely in the inferior portion of the nerve. e) The
deviation map shows entire superior edge of the nerve as ‘outside normal limits’. The corresponding sector graph indicates
either 0 or 1. The cause of this is from truncation during image acquisition. Further investigation into user error should be
done whenever the values on the image analysis does not make sense (ie. multiple measurements of 0 um RNFL thickness).
f ) A blink has caused a black line in the acquisition circle which resulted in a space on the RNFL segmentation map.
Figure 9 a
Figure 9 b
Figure 9 c
CANADIAN JOURNAL of OPTOMETRY | REVUE CANADIENNE D’OPTOMÉTRIE VOL. 79 SUPPLEMENT 1, 2017 27