
Page 633 - Microeconomics, Fourth Edition
P. 633
c15riskandinformation.qxd 8/16/10 8:18 PM Page 607
15.1 DESCRIBING RISKY OUTCOMES 607
1
0.90
0.80
0.70
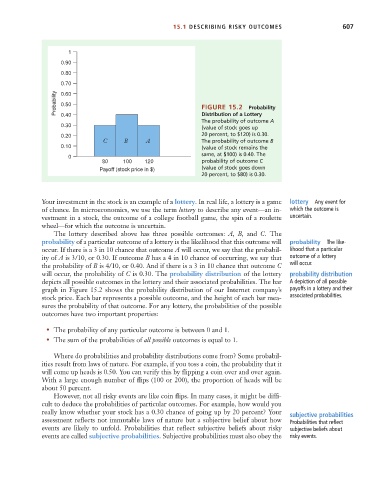
Probability 0.60 FIGURE 15.2 Probability
0.50
Distribution of a Lottery
0.40
The probability of outcome A
0.30
(value of stock goes up
0.20 20 percent, to $120) is 0.30.
C B A The probability of outcome B
0.10 (value of stock remains the
same, at $100) is 0.40. The
0
80 100 120 probability of outcome C
Payoff (stock price in $) (value of stock goes down
20 percent, to $80) is 0.30.
Your investment in the stock is an example of a lottery. In real life, a lottery is a game lottery Any event for
of chance. In microeconomics, we use the term lottery to describe any event—an in- which the outcome is
vestment in a stock, the outcome of a college football game, the spin of a roulette uncertain.
wheel—for which the outcome is uncertain.
The lottery described above has three possible outcomes: A, B, and C. The
probability of a particular outcome of a lottery is the likelihood that this outcome will probability The like-
occur. If there is a 3 in 10 chance that outcome A will occur, we say that the probabil- lihood that a particular
ity of A is 3/10, or 0.30. If outcome B has a 4 in 10 chance of occurring, we say that outcome of a lottery
will occur.
the probability of B is 4/10, or 0.40. And if there is a 3 in 10 chance that outcome C
will occur, the probability of C is 0.30. The probability distribution of the lottery probability distribution
depicts all possible outcomes in the lottery and their associated probabilities. The bar A depiction of all possible
graph in Figure 15.2 shows the probability distribution of our Internet company’s payoffs in a lottery and their
associated probabilities.
stock price. Each bar represents a possible outcome, and the height of each bar mea-
sures the probability of that outcome. For any lottery, the probabilities of the possible
outcomes have two important properties:
• The probability of any particular outcome is between 0 and 1.
• The sum of the probabilities of all possible outcomes is equal to 1.
Where do probabilities and probability distributions come from? Some probabil-
ities result from laws of nature. For example, if you toss a coin, the probability that it
will come up heads is 0.50. You can verify this by flipping a coin over and over again.
With a large enough number of flips (100 or 200), the proportion of heads will be
about 50 percent.
However, not all risky events are like coin flips. In many cases, it might be diffi-
cult to deduce the probabilities of particular outcomes. For example, how would you
really know whether your stock has a 0.30 chance of going up by 20 percent? Your subjective probabilities
assessment reflects not immutable laws of nature but a subjective belief about how Probabilities that reflect
events are likely to unfold. Probabilities that reflect subjective beliefs about risky subjective beliefs about
events are called subjective probabilities. Subjective probabilities must also obey the risky events.