
Page 635 - Microeconomics, Fourth Edition
P. 635
c15riskandinformation.qxd 8/16/10 8:18 PM Page 609
15.1 DESCRIBING RISKY OUTCOMES 609
1 1
0.90 0.90
0.80 0.80
0.70 0.70
Probability 0.60 Probability 0.60
0.50
0.50
0.40
0.40
0.30 0.30 B
0.20 0.20
C B A
0.10 0.10
C A
0 0
80 100 120 80 100 120
Payoff (stock price in $) Payoff (stock price in $)
(a) Internet company (b) Public utility company
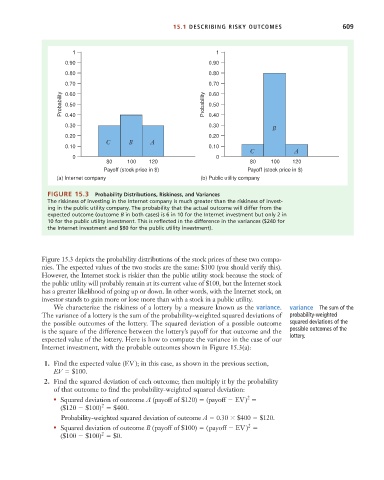
FIGURE 15.3 Probability Distributions, Riskiness, and Variances
The riskiness of investing in the Internet company is much greater than the riskiness of invest-
ing in the public utility company. The probability that the actual outcome will differ from the
expected outcome (outcome B in both cases) is 6 in 10 for the Internet investment but only 2 in
10 for the public utility investment. This is reflected in the difference in the variances ($240 for
the Internet investment and $80 for the public utility investment).
Figure 15.3 depicts the probability distributions of the stock prices of these two compa-
nies. The expected values of the two stocks are the same: $100 (you should verify this).
However, the Internet stock is riskier than the public utility stock because the stock of
the public utility will probably remain at its current value of $100, but the Internet stock
has a greater likelihood of going up or down. In other words, with the Internet stock, an
investor stands to gain more or lose more than with a stock in a public utility.
We characterize the riskiness of a lottery by a measure known as the variance. variance The sum of the
The variance of a lottery is the sum of the probability-weighted squared deviations of probability-weighted
the possible outcomes of the lottery. The squared deviation of a possible outcome squared deviations of the
is the square of the difference between the lottery’s payoff for that outcome and the possible outcomes of the
expected value of the lottery. Here is how to compute the variance in the case of our lottery.
Internet investment, with the probable outcomes shown in Figure 15.3(a):
1. Find the expected value (EV ); in this case, as shown in the previous section,
EV $100.
2. Find the squared deviation of each outcome; then multiply it by the probability
of that outcome to find the probability-weighted squared deviation:
2
• Squared deviation of outcome A (payoff of $120) (payoff EV)
2
($120 $100) $400.
Probability-weighted squared deviation of outcome A 0.30 $400 $120.
2
• Squared deviation of outcome B (payoff of $100) (payoff EV )
2
($100 $100) $0.