
Page 192 - Fiber Optic Communications Fund
P. 192
Optical Modulators and Modulation Schemes 173
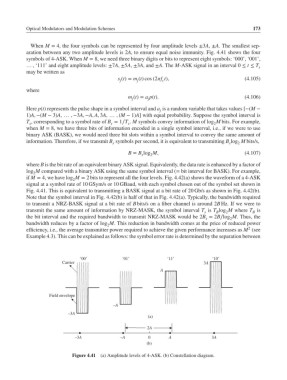
When M = 4, the four symbols can be represented by four amplitude levels ±3A, ±A. The smallest sep-
aration between any two amplitude levels is 2A, to ensure equal noise immunity. Fig. 4.41 shows the four
symbols of 4-ASK. When M = 8, we need three binary digits or bits to represent eight symbols: ‘000’, ‘001’,
… , ‘111’ and eight amplitude levels: ±7A, ±5A, ±3A, and ±A.The M-ASK signal in an interval 0 ≤ t ≤ T s
may be written as
s (t)= m (t) cos (2f t), (4.105)
c
j
j
where
m (t)= a p(t). (4.106)
j
j
Here p(t) represents the pulse shape in a symbol interval and a is a random variable that takes values [−(M −
j
1)A, −(M − 3)A, … , −3A, −A, A, 3A, … , (M − 1)A] with equal probability. Suppose the symbol interval is
T , corresponding to a symbol rate of B = 1∕T . M symbols convey information of log M bits. For example,
s s s 2
when M = 8, we have three bits of information encoded in a single symbol interval, i.e., if we were to use
binary ASK (BASK), we would need three bit slots within a symbol interval to convey the same amount of
information. Therefore, if we transmit B symbols per second, it is equivalent to transmitting B log M bits/s,
s
s
2
B = B log M, (4.107)
s 2
where B is the bit rate of an equivalent binary ASK signal. Equivalently, the data rate is enhanced by a factor of
log M compared with a binary ASK using the same symbol interval (= bit interval for BASK). For example,
2
if M = 4, we have log M = 2 bits to represent all the four levels. Fig. 4.42(a) shows the waveform of a 4-ASK
2
signal at a symbol rate of 10 GSym/s or 10 GBaud, with each symbol chosen out of the symbol set shown in
Fig. 4.41. This is equivalent to transmitting a BASK signal at a bit rate of 20 Gb/s as shown in Fig. 4.42(b).
Note that the symbol interval in Fig. 4.42(b) is half of that in Fig. 4.42(a). Typically, the bandwidth required
to transmit a NRZ-BASK signal at a bit rate of B bits/s on a fiber channel is around 2B Hz. If we were to
transmit the same amount of information by NRZ-MASK, the symbol interval T is T log M where T is
B
B
2
s
the bit interval and the required bandwidth to transmit NRZ-MASK would be 2B = 2B∕log M. Thus, the
2
s
bandwidth reduces by a factor of log M. This reduction in bandwidth comes at the price of reduced power
2
2
efficiency, i.e., the average transmitter power required to achieve the given performance increases as M (see
Example 4.3). This can be explained as follows: the symbol error rate is determined by the separation between
‘00’ ‘01’ ‘11’ ‘10’
Carrier 3A
A
Field envelope
–A
–3A
(a)
2A
–3A –A 0 A 3A
(b)
Figure 4.41 (a) Amplitude levels of 4-ASK. (b) Constellation diagram.