
Page 193 - Fiber Optic Communications Fund
P. 193
174 Fiber Optic Communications
10 11 00 10 10 10 01
1 0 1 1 00 1 0 1 0 1 00 1
3A A
A
T s −A t T b t
−3A
(a) (b)
Figure 4.42 4-ASK and BASK signal for 20 Gb/s transmission: (a) 4-ASK with T = 100 ps, (b) BASK with T = 50 ps.
s b
constellation points of Fig. 4.41(b). The larger the separation, the less is the chance of mistaking one symbol
for another. If we fix the average power and the information rate of MASK to be the same as those of BASK,
then the constellation points come closer and, therefore, the error rate increases. Equivalently, for a given error
rate, the separation between constellation points for MASK should be the same as for BASK and then the
spread of the amplitude levels would range from −(M + 1)A to (M + 1)A, whereas the corresponding range
is from −A to A for BASK. Therefore, the average power of MASK (M > 2) increases relative to BASK. The
trade-off between bandwidth and power efficiency is a common feature of all multi-level modulation formats.
4.9.2 M-PSK
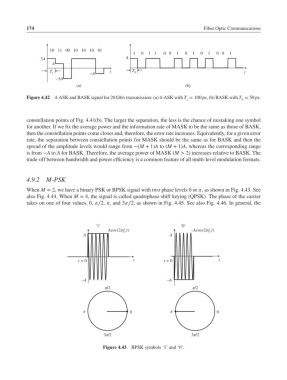
When M = 2, we have a binary PSK or BPSK signal with two phase levels 0 or , as shown in Fig. 4.43. See
also Fig. 4.44. When M = 4, the signal is called quadriphase-shift keying (QPSK). The phase of the carrier
takes on one of four values, 0, ∕2, , and 3∕2, as shown in Fig. 4.45. See also Fig. 4.46. In general, the
‘1’ ‘0’
Acos(2πf t) –Acos(2πf t)
c
c
A A
t = 0 t t = 0 t
–A –A
π/2 π/2
π 0 π 0
3π/2 3π/2
Figure 4.43 BPSK symbols ‘1’ and ‘0’.