
Page 14 - AMANGO MODEL ANSWER 1
P. 14
P a g e | 14
4.4.2 Acceptability
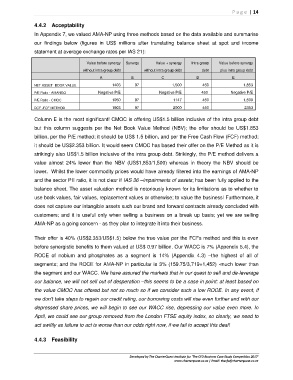
In Appendix 7, we valued AMA-NP using three methods based on the data available and summarise
our findings below (figures in US$ millions after translating balance sheet at spot and income
statement at average exchange rates per IAS 21):
Value before synergy Synergy Value + synergy Intra group Value before synergy
without intra group debt without intra group debt debt plus intra group debt
A B C D E
NET ASSET -BOOK VALUE 1403 97 1,500 450 1,853
P/E Ratio - AMANGO Negative P/E Negative P/E 450 Negative P/E
P/E Ratio - CMOC 1050 97 1147 450 1,500
DCF -FCF METHOD 1903 97 2000 450 2353
Column E is the most significant! CMOC is offering US$1.5 billion inclusive of the intra group debt
but this column suggests per the Net Book Value Method (NBV); the offer should be US$1.853
billion, per the P/E method; it should be US$ 1.5 billion, and per the Free Cash Flow (FCF) method;
it should be US$2.353 billion. It would seem CMOC has based their offer on the P/E Method as it is
strikingly also US$1.5 billion inclusive of the intra group debt. Strikingly, the P/E method delivers a
value almost 24% lower than the NBV (US$1,853/1,500) whereas in theory the NBV should be
lower. Whilst the lower commodity prices would have already filtered into the earnings of AMA-NP
and the sector PE ratio, it is not clear if IAS 36 –impairments of assets; has been fully applied to the
balance sheet. The asset valuation method is notoriously known for its limitations as to whether to
use book values, fair values, replacement values or otherwise; to value the business! Furthermore, it
does not capture our intangible assets such our brand and forward contracts already concluded with
customers; and it is useful only when selling a business on a break up basis; yet we are selling
AMA-NP as a going concern - as they plan to integrate it into their business.
Their offer is 40% (US$2.353/US$1.5) below the true value per the FCFs method and this is even
before synergistic benefits to them valued at US$ 0.97 billion. Our WACC is 7% (Appendix 5.4), the
ROCE of nobium and phosphates as a segment is 14% (Appendix 4.3) –the highest of all of
segments; and the ROCE for AMA-NP in particular is 3% (159.75/3,719+1,452) -much lower than
the segment and our WACC. We have assured the markets that in our quest to sell and de-leverage
our balance, we will not sell out of desperation –this seems to be a case in point: at least based on
the value CMOC has offered but not so much so if we consider such a low ROCE. In any event, if
we don’t take steps to regain our credit rating, our borrowing costs will rise even further and with our
depressed share prices, we will begin to see our WACC rise, depressing our value even more. In
April, we could see our group removed from the London FTSE equity index, so clearly, we need to
act swiftly as failure to act is worse than our odds right now, if we fail to accept this deal!
4.4.3 Feasibility
Developed by The CharterQuest Institute for 'The CFO Business Case Study Competition 2017'
www.charterquest.co.za | Email: thecfo@charterquest.co.za