
Page 8 - OCS Workbook - Day 1 Suggested Solutions (May 2018)
P. 8
CIMA MAY 2018 – OPERATIONAL CASE STUDY
EXERCISE 3 – DECISION MAKING
EXERCISE 3(a) – CVP Analysis
Question Your response
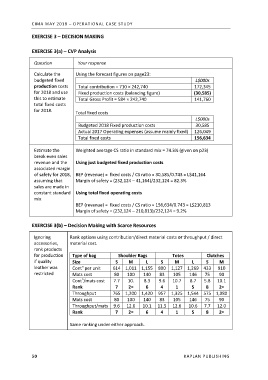
Calculate the Using the forecast figures on page23:
budgeted fixed L$000s
production costs Total contribution = 710 × 242,740 172,345
for 2018 and use Fixed production costs (balancing figure) (30,585)
this to estimate Total Gross Profit = 584 × 242,740 141,760
total fixed costs
for 2018.
Total fixed costs
L$000s
Budgeted 2018 Fixed production costs 30,585
Actual 2017 Operating expenses (assume mainly fixed) 126,049
Total fixed costs 156,634
Estimate the Weighted average CS ratio in standard mix = 74.3% (given on p23)
break even sales
revenue and the Using just budgeted fixed production costs
associated margin
of safety for 2018, BEP (revenue) = fixed costs / CS ratio = 30,585/0.743 = L$41,164
assuming that Margin of safety = (232,124 – 41,164)/232,124 = 82.3%
sales are made in
constant standard Using total fixed operating costs
mix
BEP (revenue) = fixed costs / CS ratio = 156,634/0.743 = L$210,813
Margin of safety = (232,124 – 210,813)/232,124 = 9.2%
EXERCISE 3(b) – Decision Making with Scarce Resources
Ignoring Rank options using contribution/direct material costs or throughput / direct
accessories, material cost.
rank products
for production Type of bag Shoulder Bags Totes Clutches
if quality Size S M L S M L S M
n
leather was Cont per unit 614 1,011 1,155 800 1,127 1,269 433 910
restricted Mats cost 80 100 140 83 105 146 75 90
n
Cont /mats cost 7.7 10. 8.3 9.6 10.7 8.7 5.8 10.1
Rank 7 2= 6 4 1 5 8 2=
Throughput 765 1,200 1,420 957 1,325 1,544 575 1,080
Mats cost 80 100 140 83 105 146 75 90
Throughput/mats 9.6 12.0 10.1 11.5 12.6 10.6 7.7 12.0
Rank 7 2= 6 4 1 5 8 2=
Same ranking under either approach.
50 KAPLAN PUBLISHING