
Page 297 - P1 Integrated Workbook STUDENT 2018
P. 297
Answers to supplementary objective test questions
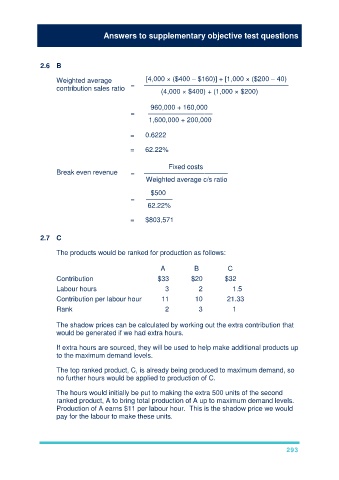
2.6 B
Weighted average [4,000 × ($400 – $160)] + [1,000 × ($200 – 40)
contribution sales ratio = ––––––––––––––––––––––––––––––––––––––
(4,000 × $400) + (1,000 × $200)
Weighted average 960,000 + 160,000
contribution sales ratio = –––––––––––––––––
1,600,000 + 200,000
= 0.6222
= 62.22%
Fixed costs
Break even revenue = ––––––––––––––––––––––
Weighted average c/s ratio
$500
Break even revenue = –––––––
62.22%
= $803,571
2.7 C
The products would be ranked for production as follows:
A B C
Contribution $33 $20 $32
Labour hours 3 2 1.5
Contribution per labour hour 11 10 21.33
Rank 2 3 1
The shadow prices can be calculated by working out the extra contribution that
would be generated if we had extra hours.
If extra hours are sourced, they will be used to help make additional products up
to the maximum demand levels.
The top ranked product, C, is already being produced to maximum demand, so
no further hours would be applied to production of C.
The hours would initially be put to making the extra 500 units of the second
ranked product, A to bring total production of A up to maximum demand levels.
Production of A earns $11 per labour hour. This is the shadow price we would
pay for the labour to make these units.
293