
Page 10 - FINAL CFA II SLIDES JUNE 2019 DAY 9
P. 10
LOS 34.d: Describe the assumptions concerning the READING 34: THE TERM STRUCTURE AND
evolution of spot rates in relation to forward rates
implicit in active bond portfolio management. INTEREST RATE DYNAMICS
MODULE 34.2: SPOT AND FORWARD RATES, PART 2
RELATIONSHIPS BETWEEN SPOT AND FORWARD RATES
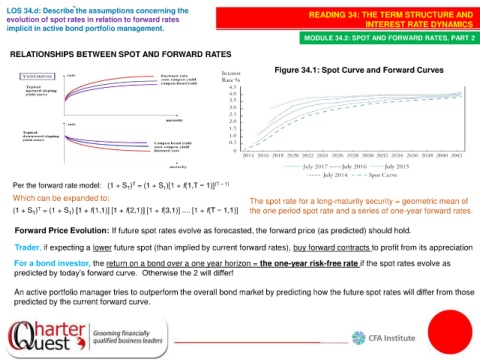
Figure 34.1: Spot Curve and Forward Curves
T
Per the forward rate model: (1 + S ) = (1 + S )[1 + f(1,T − 1)] (T – 1)
T
1
Which can be expanded to: The spot rate for a long-maturity security = geometric mean of
T
(1 + S ) = (1 + S ) [1 + f(1,1)] [1 + f(2,1)] [1 + f(3,1)] .... [1 + f(T − 1,1)] the one period spot rate and a series of one-year forward rates.
T
1
Forward Price Evolution: If future spot rates evolve as forecasted, the forward price (as predicted) should hold.
Trader, if expecting a lower future spot (than implied by current forward rates), buy forward contracts to profit from its appreciation
For a bond investor, the return on a bond over a one year horizon = the one-year risk-free rate if the spot rates evolve as
predicted by today’s forward curve. Otherwise the 2 will differ!
An active portfolio manager tries to outperform the overall bond market by predicting how the future spot rates will differ from those
predicted by the current forward curve.